Alteryx uses the spatial object which can be used for spatial analytics. It does this by generating geo points using longitude and latitude from the data set. These points can be combined to make a polyline and polygons. This data can be used to get insight into how location factors into other aspects of business operations. In this blog, I highlight few of the tools to get you start spatial analyzing in Alteryx.
The spatial tool used in this sample data are:


 Create Points Distance Find Nearest
Distance tool
In essence, this tool is used to calculate the distance between two geo points, a line or polygon. It can also be used to calculate drive time
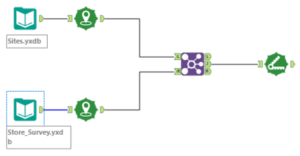
The Alteryx workflow below shows how the Distance Tool can be used. In this example, I am trying to calculate the distance customers travel to a certain store. Since my data for customer location and store location are in different files, I had to perform a join. However, before I do this I used the Create Point tool to produce a geo points from the longitude and latitude.
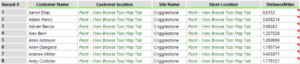
Here are the results. The next step to this analysis I can look at is: are the customers going to the closest store from their location or are there other stores which are closer to them. To perform this task, Finding Nearest tool has to be utilized.
Also, do note in this example I am using the physical distance (not road distance).
Find Nearest
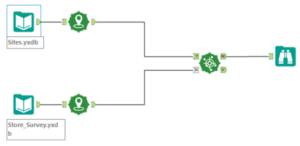
Find Nearest tool is used to find the closest points and/or polygons in different sets of data. The workflow below shows how this tool can be utilized. Unlike the Distance tool, this has two inputs, one is Target ‘T’ and Universe ‘U’, in the target section I have joined the location of the store and in the Universe input, I joined the location of the customers.
This tool produces two outputs ‘M’ – gives all the matched data whereas ‘U’ shows the unmatched.
The result section below shows the closest store to each of the customers. If the customers are already going to their closest store then this can be filtered out.
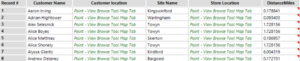
These fields tool can be effective for further advanced mapping analytics.
