[et_pb_section bb_built=”1″ admin_label=”section”][et_pb_row admin_label=”Row”][et_pb_column type=”2_3″][et_pb_text admin_label=”Text”]
Dashboard week is my absolute favourite week of the training curriculum. It’s a really, really tough week and I must admit that DS5 had it harder than any other previous group. Not only did they have to create a new dashboard every day with a data set they’ve never seen, they also had to do the data prep (well, I saved them from that on day 4).
[/et_pb_text][/et_pb_column][et_pb_column type=”1_3″][/et_pb_column][/et_pb_row][et_pb_row admin_label=”row”][et_pb_column type=”2_3″][et_pb_text admin_label=”Text” background_layout=”light” text_orientation=”left” use_border_color=”off” border_color=”#ffffff” border_style=”solid”]
DAY 1 – U.K. STREET CRIMES
[/et_pb_text][et_pb_text admin_label=”Text” background_layout=”light” text_orientation=”left” use_border_color=”off” border_color=”#ffffff” border_style=”solid”]
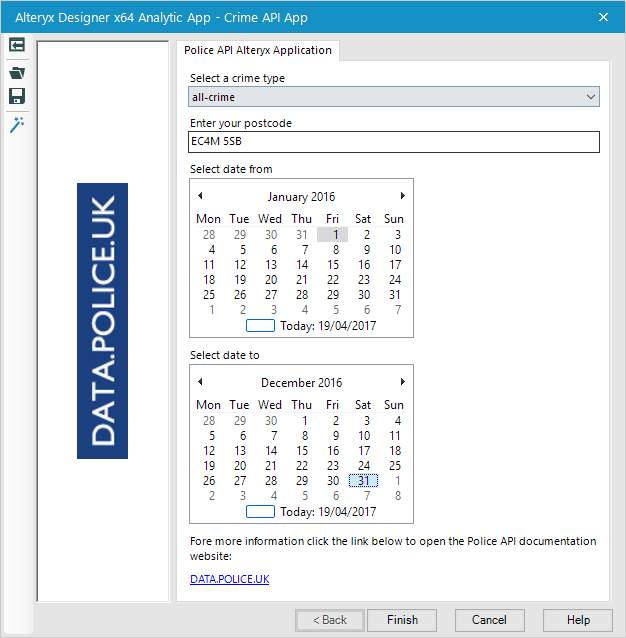
Using the U.K. street crimes API, they each had to create an Alteryx app that called the API, which then rendered a Tableau dashboard. The most fascinating part of day 1 was to see how different all of their workflows where given they were all basically doing the same thing. That’s the beauty of Alteryx; it works the way your brain works.
Here’s an example workflow that Marc Reid created and here’s a link to his exceptionally well documented workflow:
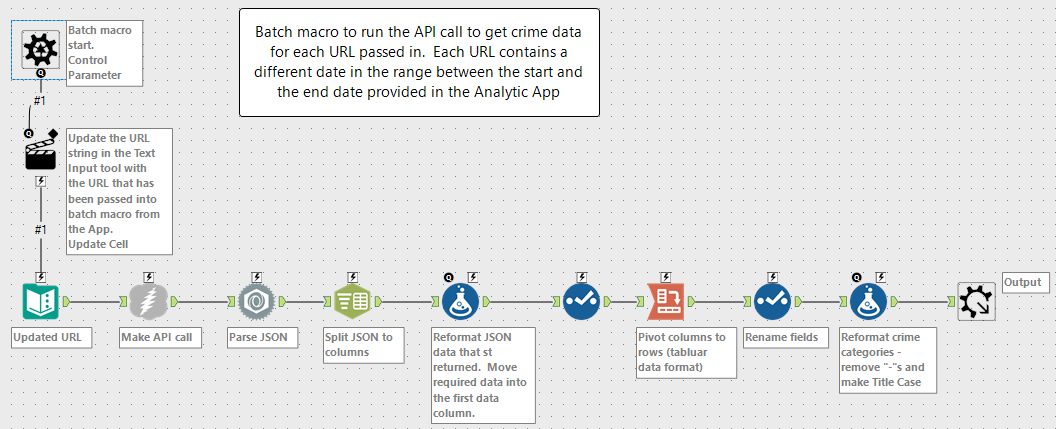
And the app he build on top of it:
[/et_pb_text][et_pb_text admin_label=”Text” background_layout=”light” text_orientation=”left” use_border_color=”off” border_color=”#ffffff” border_style=”solid”]
And here are three of my favourites from day 1. Click on any of the images for a larger view.
[/et_pb_text][/et_pb_column][et_pb_column type=”1_3″][/et_pb_column][/et_pb_row][et_pb_row admin_label=”Row”][et_pb_column type=”1_4″][et_pb_image admin_label=”Image” src=”/content/images/wordpress/2017/04/Final-Dashboard.png” show_in_lightbox=”on” url_new_window=”off” use_overlay=”off” animation=”left” sticky=”off” align=”left” force_fullwidth=”off” always_center_on_mobile=”on” use_border_color=”off” border_color=”#ffffff” border_style=”solid”] [/et_pb_image][/et_pb_column][et_pb_column type=”1_4″][et_pb_image admin_label=”Image” src=”/content/images/wordpress/2017/04/08-Crime-Dashboard.png” show_in_lightbox=”on” url_new_window=”off” use_overlay=”off” animation=”left” sticky=”off” align=”left” force_fullwidth=”off” always_center_on_mobile=”on” use_border_color=”off” border_color=”#ffffff” border_style=”solid”] [/et_pb_image][/et_pb_column][et_pb_column type=”1_4″][et_pb_image admin_label=”Image” src=”/content/images/wordpress/2017/04/UK-crimes-dashboard.png” show_in_lightbox=”on” url_new_window=”off” use_overlay=”off” animation=”left” sticky=”off” align=”left” force_fullwidth=”off” always_center_on_mobile=”on” use_border_color=”off” border_color=”#ffffff” border_style=”solid”] [/et_pb_image][/et_pb_column][et_pb_column type=”1_4″][/et_pb_column][/et_pb_row][et_pb_row admin_label=”row”][et_pb_column type=”2_3″][et_pb_text admin_label=”Text” background_layout=”light” text_orientation=”left” use_border_color=”off” border_color=”#ffffff” border_style=”solid”]
DAY 2 – INTERNATIONAL MIGRANTS
[/et_pb_text][et_pb_text admin_label=”Text” background_layout=”light” text_orientation=”left” use_border_color=”off” border_color=”#ffffff” border_style=”solid”]
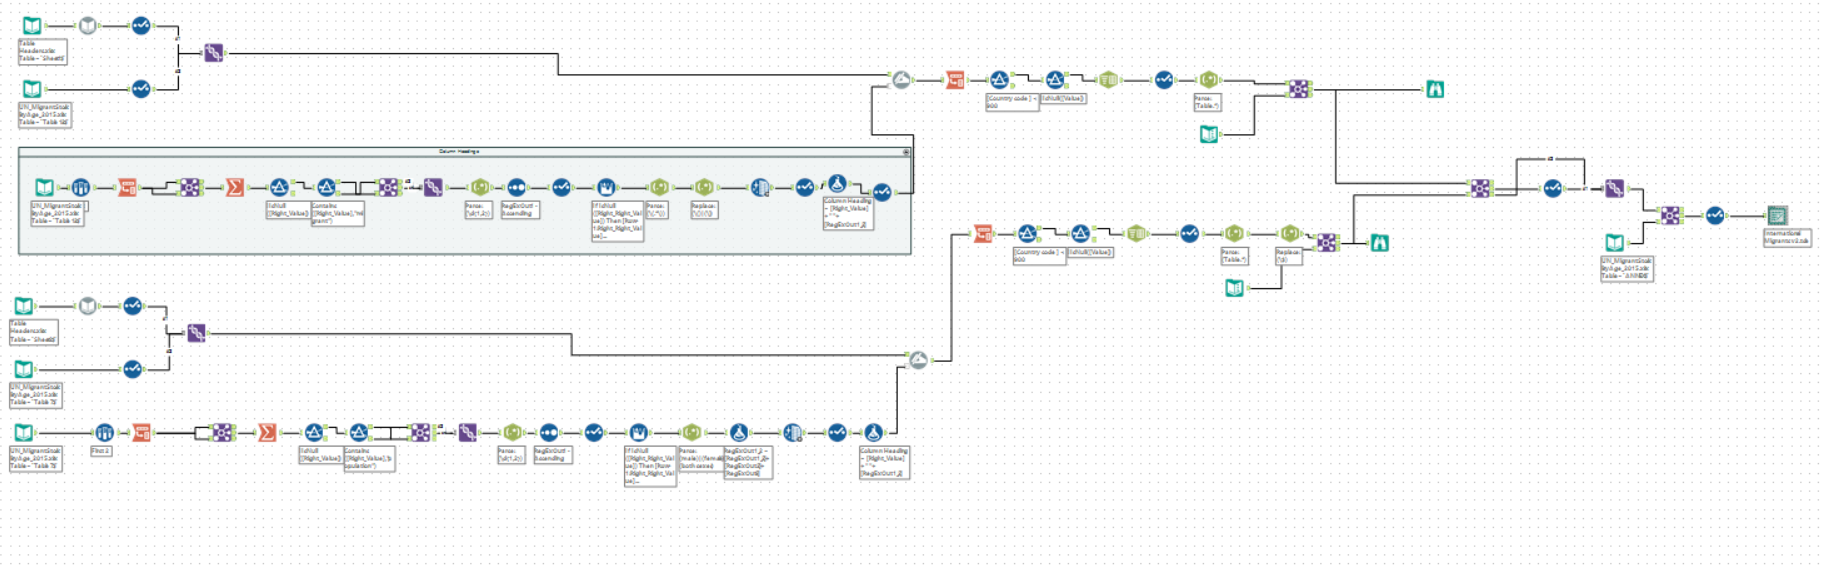
Day 2 again required data prep in Alteryx and a dashboard, but I did relieve them on the need to create an app. They had to download a series of spreadsheets, massage them with Alteryx and create a Tableau extract for their dashboard. Most of the workflows were pretty similar, an example here by Neil Lord that, while appearing complicated on the outset, really isn’t that complicated. The reason there are so many tool is because there was tons of “little” cleanup to do. Read Neil’s post here.
[/et_pb_text][et_pb_text admin_label=”Text” background_layout=”light” text_orientation=”left” use_border_color=”off” border_color=”#ffffff” border_style=”solid”]
And here are three of my favourites from day 2. Click on any of the images for a larger view.
[/et_pb_text][/et_pb_column][et_pb_column type=”1_3″][/et_pb_column][/et_pb_row][et_pb_row admin_label=”Row”][et_pb_column type=”1_4″][et_pb_image admin_label=”Image” src=”/content/images/wordpress/2017/04/International-Migrants.png” show_in_lightbox=”on” url_new_window=”off” use_overlay=”off” animation=”left” sticky=”off” align=”left” force_fullwidth=”off” always_center_on_mobile=”on” use_border_color=”off” border_color=”#ffffff” border_style=”solid”] [/et_pb_image][/et_pb_column][et_pb_column type=”1_4″][et_pb_image admin_label=”Image” src=”/content/images/wordpress/2017/04/UN_Migration-508×1024.png” show_in_lightbox=”on” url_new_window=”off” use_overlay=”off” animation=”left” sticky=”off” align=”left” force_fullwidth=”off” always_center_on_mobile=”on” use_border_color=”off” border_color=”#ffffff” border_style=”solid”] [/et_pb_image][/et_pb_column][et_pb_column type=”1_4″][et_pb_image admin_label=”Image” src=”/content/images/wordpress/2017/04/Dashboard.png” show_in_lightbox=”on” url_new_window=”off” use_overlay=”off” animation=”left” sticky=”off” align=”left” force_fullwidth=”off” always_center_on_mobile=”on” use_border_color=”off” border_color=”#ffffff” border_style=”solid”] [/et_pb_image][/et_pb_column][et_pb_column type=”1_4″][/et_pb_column][/et_pb_row][et_pb_row admin_label=”row”][et_pb_column type=”2_3″][et_pb_text admin_label=”Text” background_layout=”light” text_orientation=”left” use_border_color=”off” border_color=”#ffffff” border_style=”solid”]
DAY 3 – RISK FACTORS FROM NONCOMMUNICABLE DISEASES
[/et_pb_text][et_pb_text admin_label=”Text” background_layout=”light” text_orientation=”left” use_border_color=”off” border_color=”#ffffff” border_style=”solid”]
Without realising it, I had picked yet another dark, depressing topic for day 3. Sorry team! Honest mistake! The data set was of risk factors for non-communicable diseases and the team had to download the data for each topic and each country via Alteryx before building their dashboards.
This was definitely their easiest Alteryx workflow of the week. Basically they needed to create the URL structure to download a CSV, then set up a formula to repeat that for each combination. Laura Peterson created her workflow via two containers like this:
Container 1 -Download .csv files to her computer
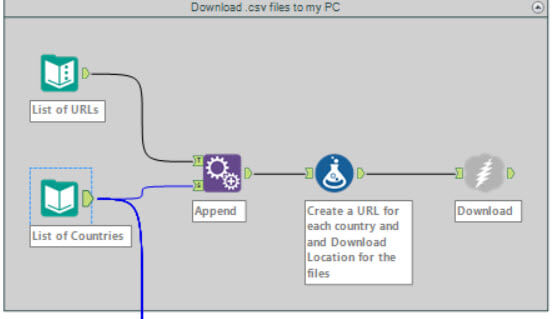
Container 2 – Union all 600 files into one .yxdb
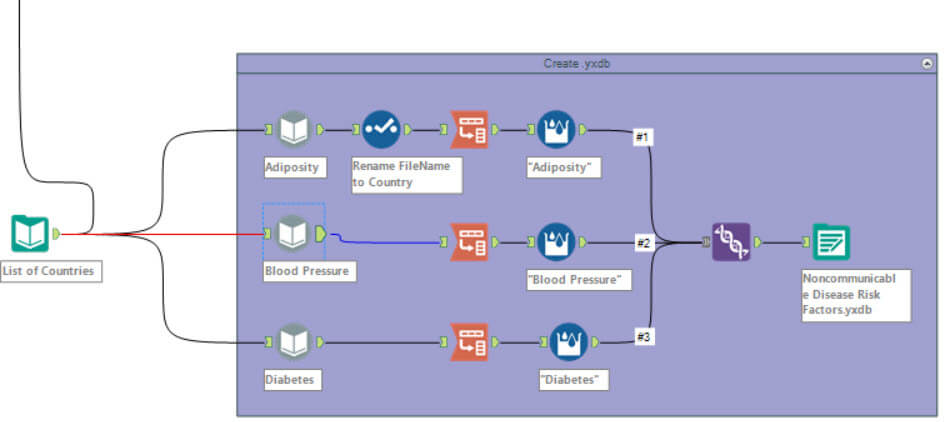
From there she simply created a TDE.
[/et_pb_text][et_pb_text admin_label=”Text” background_layout=”light” text_orientation=”left” use_border_color=”off” border_color=”#ffffff” border_style=”solid”]
And here are three of my favourites from day 3. Click on any of the images for a larger view.
[/et_pb_text][/et_pb_column][et_pb_column type=”1_3″][/et_pb_column][/et_pb_row][et_pb_row admin_label=”Row”][et_pb_column type=”1_4″][et_pb_image admin_label=”Image” src=”/content/images/wordpress/2017/04/Adiposity.png” show_in_lightbox=”on” url_new_window=”off” use_overlay=”off” animation=”left” sticky=”off” align=”left” force_fullwidth=”off” always_center_on_mobile=”on” use_border_color=”off” border_color=”#ffffff” border_style=”solid”] [/et_pb_image][/et_pb_column][et_pb_column type=”1_4″][et_pb_image admin_label=”Image” src=”/content/images/wordpress/2017/04/Screen-Shot-2017-04-25-at-10.00.10-pm.png” show_in_lightbox=”on” url_new_window=”off” use_overlay=”off” animation=”left” sticky=”off” align=”left” force_fullwidth=”off” always_center_on_mobile=”on” use_border_color=”off” border_color=”#ffffff” border_style=”solid”] [/et_pb_image][/et_pb_column][et_pb_column type=”1_4″][et_pb_image admin_label=”Image” src=”/content/images/wordpress/2017/04/Screen-Shot-2017-04-25-at-10.03.03-pm.png” show_in_lightbox=”on” url_new_window=”off” use_overlay=”off” animation=”left” sticky=”off” align=”left” force_fullwidth=”off” always_center_on_mobile=”on” use_border_color=”off” border_color=”#ffffff” border_style=”solid”] [/et_pb_image][/et_pb_column][et_pb_column type=”1_4″][/et_pb_column][/et_pb_row][et_pb_row admin_label=”row”][et_pb_column type=”2_3″][et_pb_text admin_label=”Text” background_layout=”light” text_orientation=”left” use_border_color=”off” border_color=”#ffffff” border_style=”solid”]
DAY 4 – MY RUNKEEPER TRAINING
[/et_pb_text][et_pb_text admin_label=”Text” background_layout=”light” text_orientation=”left” use_border_color=”off” border_color=”#ffffff” border_style=”solid”]
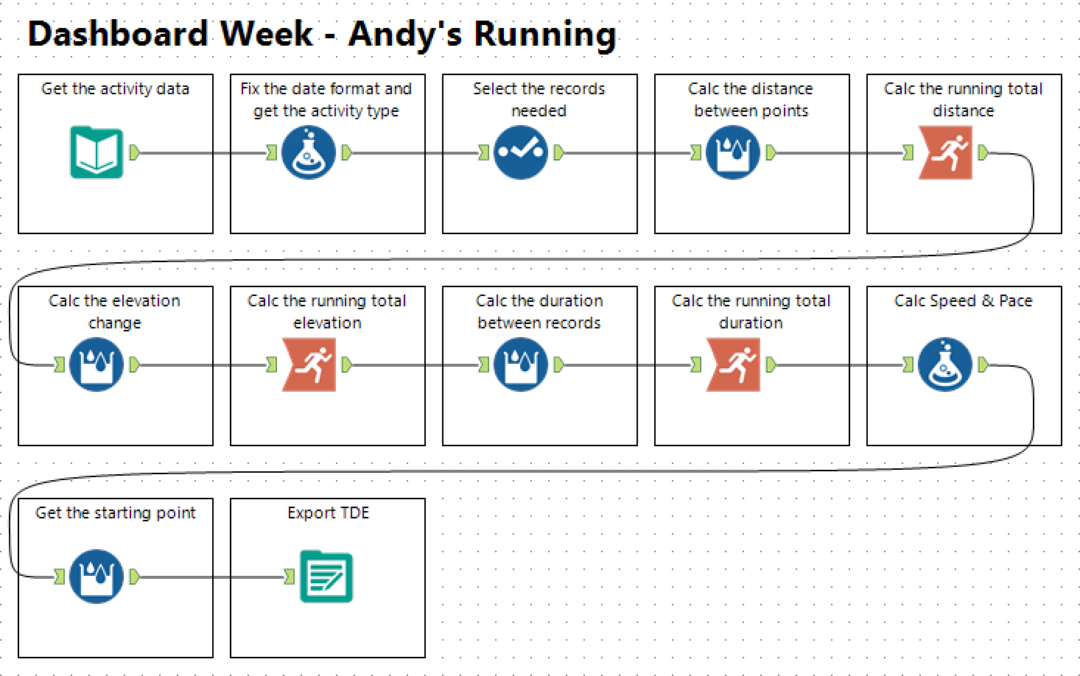
First, thank you to Laura for alerting me to my morbid topics earlier in the week. Week 4 was going to be another downer, so I changed course and gave them an already prepared data set of 323 runs of mine. Yup, you read that right, now Alteryx today! Aren’t they lucky to have me as their coach??
Laura did create her own workflow, so extra brownie points for her. Here’s the workflow I created:
[/et_pb_text][et_pb_text admin_label=”Text” background_layout=”light” text_orientation=”left” use_border_color=”off” border_color=”#ffffff” border_style=”solid”]
The team really had some fun with this data! Here are all of their creations from day 4. Click on any of the images for a larger view.
[/et_pb_text][/et_pb_column][et_pb_column type=”1_3″][/et_pb_column][/et_pb_row][et_pb_row admin_label=”Row”][et_pb_column type=”1_4″][et_pb_image admin_label=”Image” src=”/content/images/wordpress/2017/04/C-BBB4UXoAALVWu.jpg” show_in_lightbox=”on” url_new_window=”off” use_overlay=”off” animation=”left” sticky=”off” align=”left” force_fullwidth=”off” always_center_on_mobile=”on” use_border_color=”off” border_color=”#ffffff” border_style=”solid”] [/et_pb_image][et_pb_image admin_label=”Image” src=”/content/images/wordpress/2017/04/Screen-Shot-2017-04-23-at-20.06.40-1080×869.png” show_in_lightbox=”on” url_new_window=”off” use_overlay=”off” animation=”left” sticky=”off” align=”left” force_fullwidth=”off” always_center_on_mobile=”on” use_border_color=”off” border_color=”#ffffff” border_style=”solid”] [/et_pb_image][/et_pb_column][et_pb_column type=”1_4″][et_pb_image admin_label=”Image” src=”/content/images/wordpress/2017/04/Dash-board-1.png” show_in_lightbox=”on” url_new_window=”off” use_overlay=”off” animation=”left” sticky=”off” align=”left” force_fullwidth=”off” always_center_on_mobile=”on” use_border_color=”off” border_color=”#ffffff” border_style=”solid”] [/et_pb_image][et_pb_image admin_label=”Image” src=”/content/images/wordpress/2017/04/Runkeeper-Dashboard.png” show_in_lightbox=”on” url_new_window=”off” use_overlay=”off” animation=”left” sticky=”off” align=”left” force_fullwidth=”off” always_center_on_mobile=”on” use_border_color=”off” border_color=”#ffffff” border_style=”solid”] [/et_pb_image][et_pb_image admin_label=”Image” src=”/content/images/wordpress/2017/04/Screen-Shot-2017-04-25-at-10.23.46-pm.png” show_in_lightbox=”on” url_new_window=”off” use_overlay=”off” animation=”left” sticky=”off” align=”left” force_fullwidth=”off” always_center_on_mobile=”on” use_border_color=”off” border_color=”#ffffff” border_style=”solid”] [/et_pb_image][/et_pb_column][et_pb_column type=”1_4″][et_pb_image admin_label=”Image” src=”/content/images/wordpress/2017/04/Screen-Shot-2017-04-23-at-11.11.04-1080×1276.png” show_in_lightbox=”on” url_new_window=”off” use_overlay=”off” animation=”left” sticky=”off” align=”left” force_fullwidth=”off” always_center_on_mobile=”on” use_border_color=”off” border_color=”#ffffff” border_style=”solid”] [/et_pb_image][et_pb_image admin_label=”Image” src=”/content/images/wordpress/2017/04/final.png” show_in_lightbox=”on” url_new_window=”off” use_overlay=”off” animation=”left” sticky=”off” align=”left” force_fullwidth=”off” always_center_on_mobile=”on” use_border_color=”off” border_color=”#ffffff” border_style=”solid”] [/et_pb_image][et_pb_image admin_label=”Image” src=”https://pbs.twimg.com/media/C-HZ1xtXYAAzsQ-.jpg” show_in_lightbox=”on” url_new_window=”off” use_overlay=”off” animation=”left” sticky=”off” align=”left” force_fullwidth=”off” always_center_on_mobile=”on” use_border_color=”off” border_color=”#ffffff” border_style=”solid”] [/et_pb_image][/et_pb_column][et_pb_column type=”1_4″][/et_pb_column][/et_pb_row][et_pb_row admin_label=”Row”][et_pb_column type=”2_3″][et_pb_text admin_label=”Text” background_layout=”light” text_orientation=”left” use_border_color=”off” border_color=”#ffffff” border_style=”solid”]
DS5, I’m incredibly proud of you! You persevered. You made it through the toughest Dashboard Week to date. Now you can laugh at DS6 when I make it even harder for them. That’s only fair, right?
[/et_pb_text][/et_pb_column][et_pb_column type=”1_3″][/et_pb_column][/et_pb_row][/et_pb_section]