This week Nicco Cirone showed me a viz he had created to show the US election results. It was a remake of a visualisation in the FT.
The FT used hexagons to represent the number of voters in each state. I was inspired to see if I could find a way to use Alteryx to make the hexagons appear in Tableau. Here’s how I achieved it:
| Cycle | S1 | S2 | S3 | S4 | S5 | S6 |
| 1 | 1 | 1 | 1 | 1 | 2 | 1 |
On the back of a napkin I drew a hexagonal spiral and noted down a couple of observations about the length and direction of the lines. The difference between drawing a spiral rather than a hexagon is that one side in six is longer than the others. So to get started in Alteryx, I created a text input of the length of the initial lines. Then using the Generate rows formula I was able to create further rows (cycles) in the table, which contained values always 1 greater than the row above. The next step was to transpose the data so we now have ‘Side name’ and ‘Side length’ as columns. I then added a text field called splitter using the formula tool, this was a string of the letter a as long as the side length.
| Cycle | Side | Value | Splitter |
| 1 | S1 | 1 | a |
| 1 | S2 | 1 | a |
| 1 | S3 | 1 | a |
| 1 | S4 | 1 | a |
| 1 | S5 | 2 | aa |
| 1 | S6 | 1 | a |
The Splitter field can then be used in the text to columns tool (ticking split to rows and using ‘a’ as the delimiter). The Value and Splitter fields are no longer needed. We now have a row for each point or hexagon:
| Cycle | Side |
| 1 | S1 |
| 1 | S2 |
| 1 | S3 |
| 1 | S4 |
| 1 | S5 |
| 1 | S5 |
| 1 | S6 |
The next step is to add the x change and y change for each side. I worked out what these were by doing a quick sketch. These values were there then appended to the table using the formula tool:
For the x change values:
if [Name] = ‘S1’ then -1
elseif [Name] = ‘S2’ then -2
elseif [Name] = ‘S3’ then -1
elseif [Name] = ‘S4’ then 1
elseif [Name] = ‘S5’ then 2
elseif [Name] = ‘S6’ then 1
else 0
endif
For the y change values:
if [Name] = ‘S1’ then 2
elseif [Name] = ‘S2’ then 0
elseif [Name] = ‘S3’ then -2
elseif [Name] = ‘S4’ then -2
elseif [Name] = ‘S5’ then 0
elseif [Name] = ‘S6’ then 2
else 0
endif
Next we need to use the x and y change values to generate the x and y coordinates of each point. Here’s the formula used in the multi-row formula tool:
x = [Row-1:x]+[x change]
y = [Row-1:y]+[y change]
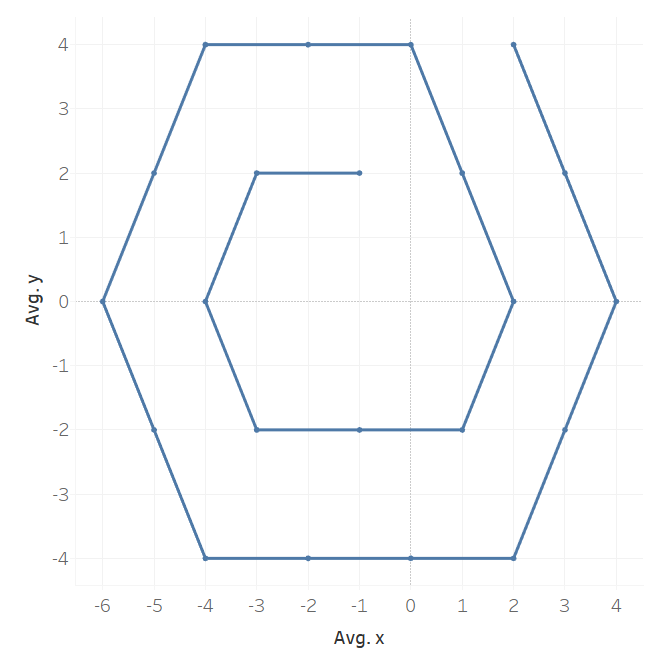
The next step is to add row numbers using the record ID tool. This is needed when we join the hex coordinates to data that we want to visualise. If we put our current table into output into Tableau as a line chart this is what we get:
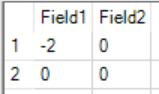
We are missing the first couple of points so I add these in manually in Alteryx. This needs to be unioned to the top of the table we already created and then re-run the record ID tool.
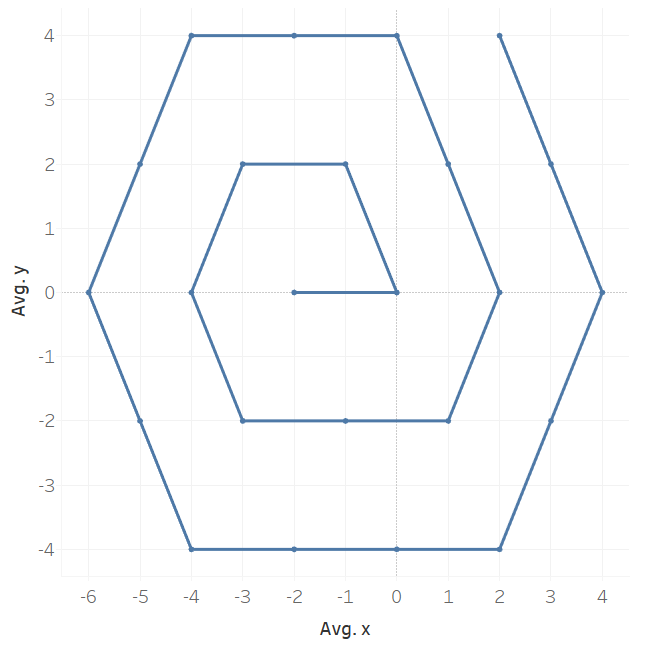
We now have a complete hex spiral (only the first 24 records shown):
In my next blog I will explain how to use this to plot the hex shapes on the map.