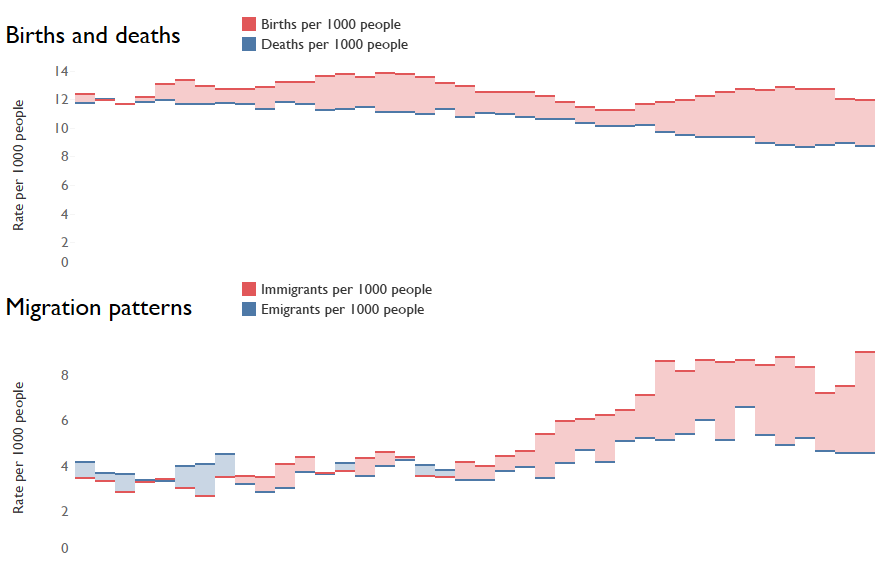
I was looking at UK population statistics recently to see how the rates of births, deaths, immigration, and emigration rates have changed over the last few decades.

I had a bit of an issue with Gantt bars in Tableau while doing this. Dragging the size control all the way up controls how wide the bar is, but you can’t do anything about the thickness of the bar.
That’s frustrating. It doesn’t look too bad, but the thinness of the lines makes it hard to hover over easily to see the information in the tooltips. So, we want to make them thicker, but can’t do that just with the size control.
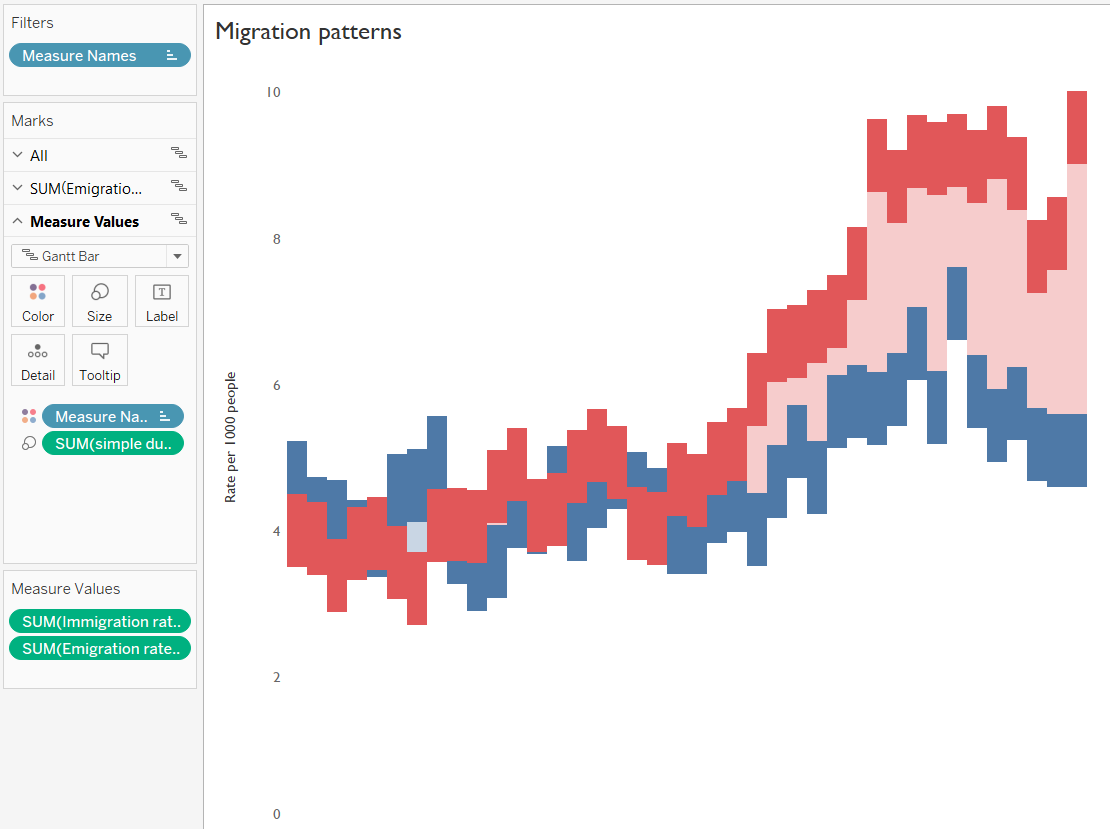
What we can do is create a dummy variable to drag onto the size shelf. Let’s just go for 1 right now:

You can drag this onto the size shelf, and voila, the Gantt bars are much thicker:

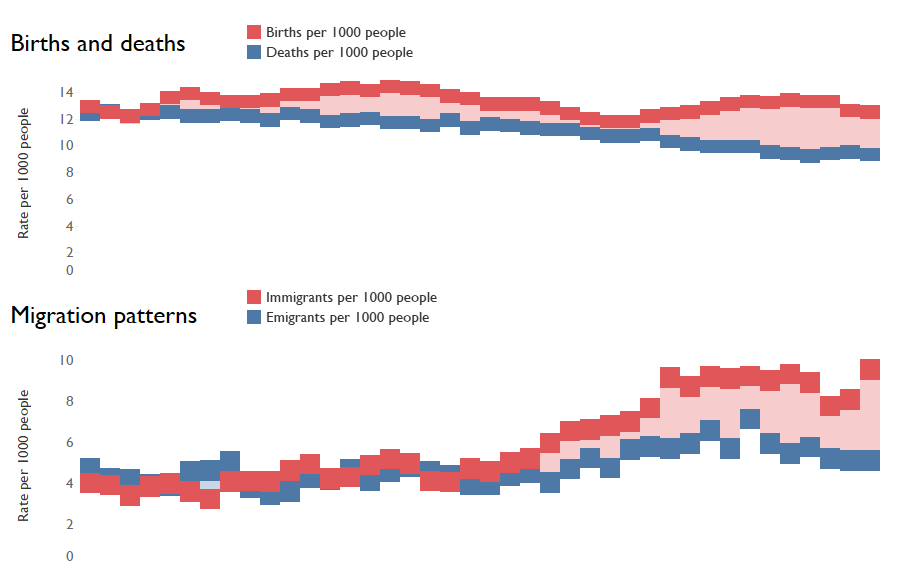
But this creates another problem. The dummy variable is consistent (as it’s just the number 1), but the size is based on the y-axis scale. That means that setting the size to 1 is going to create thicker bars on graphs where the y-axis doesn’t have much of a range, and thinner bars on graphs where the y-axis has a huge range (and if all the data was between 0 and 0.99, the Gantt bars would take up the entire view). Here, the ranges on the two graphs are similar, but the range on Births and deaths graph is a bit larger than the Migration patterns graph, large enough to be noticeable on the dashboard:

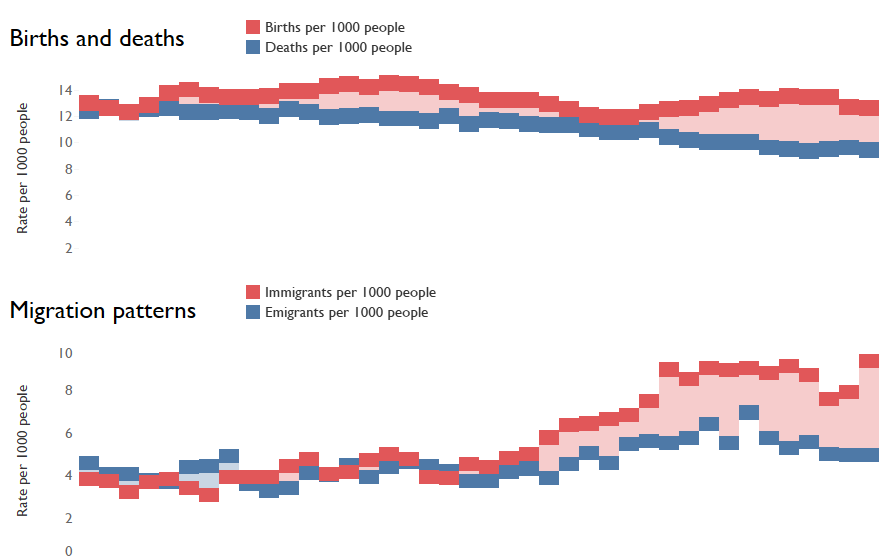
Instead, we want to create a dummy variable which will result in visually consistent Gantt bar thickness across different y-axis scales. The maximum value will dictate the y-axis scale (if the axes are automatic), so we want the dummy variable to be a constant as compared to the maximum value. Just doing max() won’t work, as it’ll take the maximum for each value on the discrete x-axis. Instead, we need to look for the max value, then the window max, which looks for the maximum value across the table. We also need to make that a lot smaller, otherwise the Gantt bar will take up most of the view, so we can multiply it by 0.1.

Drag these dummy calculations onto the relevant Gantt bar size shelves, and there we go; nice thick Gantt bars with visually consistent thickness across graphs with differently-scaled y-axes.

