Where the hell did that last month go?
The 4th week at the Data School has come to an end after a long long long long…. long week of learning calculations, table calculations, taking part in #MakeoverMonday live, learning how to demo Alteryx and learning how to visualise survey data all whilst trying to complete a new and fun client project, which the DS6 team pulled together to absolutely smash and deliver a great bunch of presentations to the client.
So, with that out of the way, I wanted to blog about an interesting tool that we were introduced to today during our survey data training… The Tableau Data Reshaping Tool which allows you to reshape your data easily within Excel.
This cool little tool simply adds a new header to your Excel and allows you to pivot column heavy documents into more Tableau friendly row heavy tables with headers and the data perfectly aligned ready to pull into Tableau.
So how does it work?
To start, you will need to download your tool from https://community.tableau.com/docs/DOC-10394 and follow the instructions on how to install the tool.
Once installed and configured in Excel you will now have an added Tableau header and will have the following options once clicking the header:

Reshape data
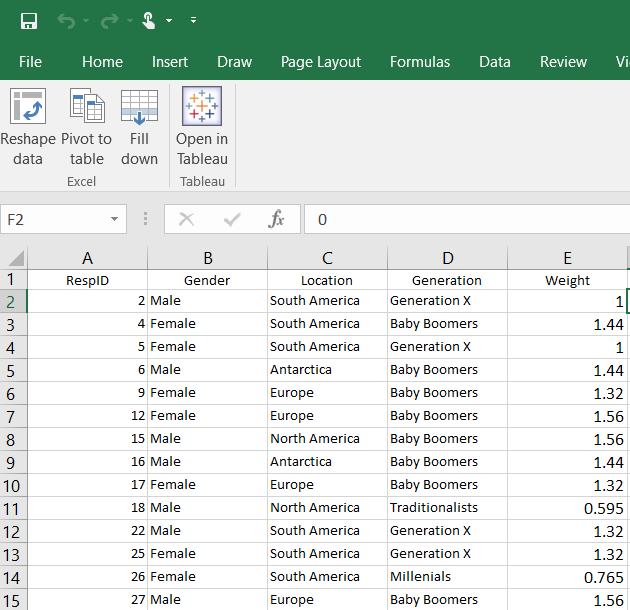
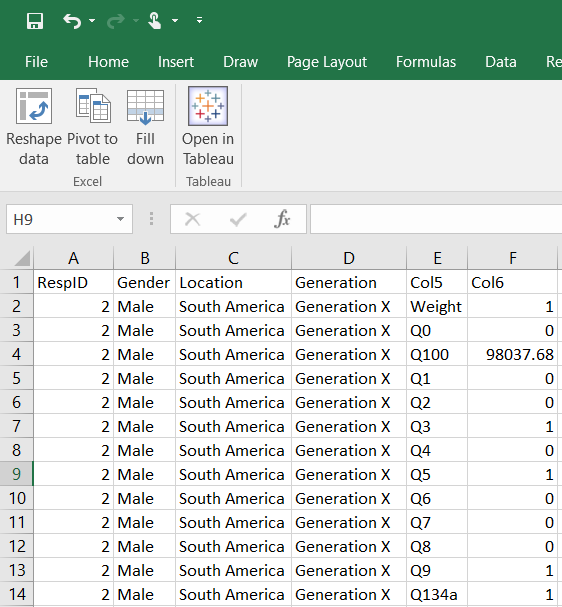
This tool allows you to transpose your column headers so that they now become rows (horizontal to vertical). You can either highlight a bunch of headers and transpose them using the advanced settings or you can select a single cell at the top of your list in row 2, click the reshape data tool, click OK and tada! Your headers are now listed in rows. Example below:
Before –
After –
Fill down
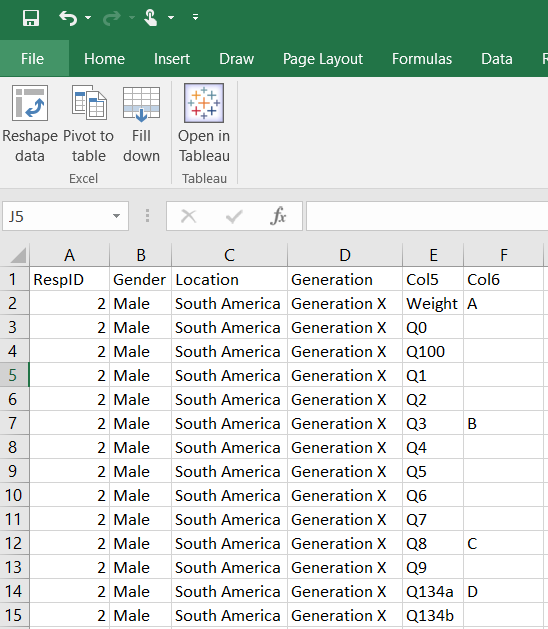
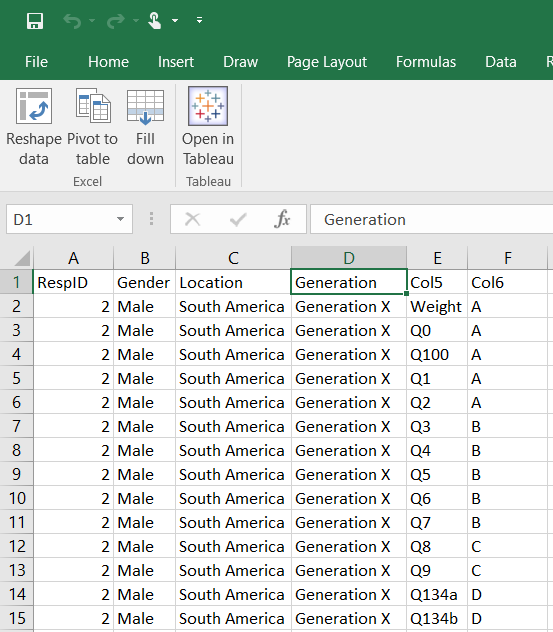
This tool fills any gaps in your columns by replacing the empty cell with the same value as the cell above it. For example, imagine in the image above that cell F5 was empty. Clicking anywhere above that cell and pressing the fill down button will fill that empty cell with the value ‘98037.68’ (same as cell F4).
This can prove handy if your data is in order and you ‘know’ that the empty cells are meant to be filled with the same value as the cell above. Not so useful if you need to have a different value to that of the above.
Before –
After (clicked on cell F1 and pressed ‘Fill down’ to populate empty cells). See how it has copied the content from the cells above the gaps? –
Pivot to table
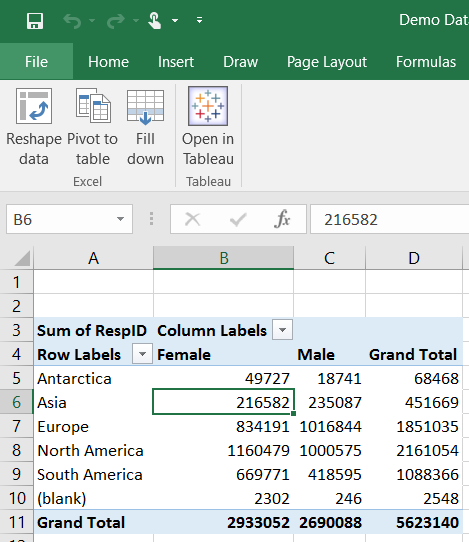
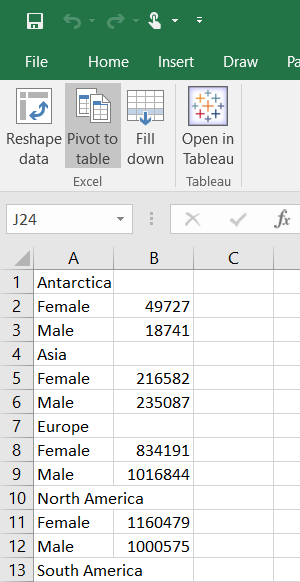
Pivot to table allows you to transform any data you have laid out in a pivot table into a Tableau type table layout. What I mean by this is that any row headers in the pivot table get split into individual rows with the numbers aligned in the next column.
Before (data in an Excel pivot table) –
After –
Open in Tableau
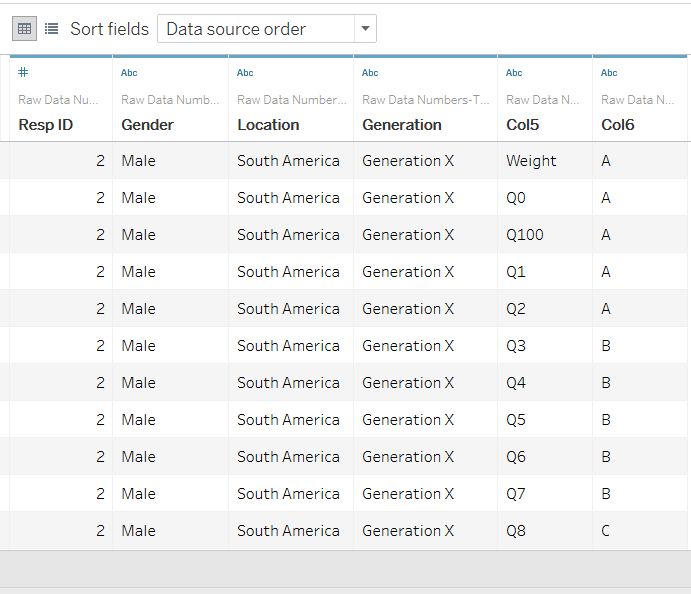
Lastly, we move on to the Open in Tableau tool which allows you to upload your Excel workbook and any data within it straight to Tableau to begin visualising the data you have prepared.
Before –

After –
I hope you found this blog on the Tableau add-in for Excel useful? Hopefully, it will save you loads of time when preparing your data to be uploaded to Tableau.
