Hello, everyone!
The other DSers weren’t kidding when they said that Dashboard Week gets harder every day. My brain is completely fried. It’s actually been quite interesting to see how much more difficult it is to get creative with our dashboards as the days go by as our mental faculties deteriorate and the sleep deprivation gets worst. Oh well, just another week at the Data School (don’t get me wrong, I wouldn’t sign up for any other job – this right here is as good as it gets). After seeing how much we struggled to get public transit data yesterday, Andy wanted to be nice and gave us what appeared to be a lovely website with loads of food-related data from the US. The online portal of the United State’s Department of Agriculture Research Service provides in-depth nutritional information about all the products sold in the country. I was blessed with the primordial task of digging deep into everyone’s favorite drunk food: hot dogs.
At first, all my peers and I rejoiced with the sight of beautiful tables and a simple-to-use API. Except, we could only make 1000 API calls per day. We all had thousands of products to look into. Our smiles quickly vanished as we all knew, yes, once again, we are going to spend all day in Alteryx trying to clean some poorly scraped data. Good thing is though, I now know how to do a bunch of really cool stuff. Let me show you!
What’s a batch macro?
Macros are a neat little way of packaging a set of tools in Alteryx in order to easily repeat workflows designed to do one simple task. You can think of it as a workflow controlled by a set of parameters. A batch macro is one that will pretty much allow you to iteratively repeat the same steps for each row in a field. In my case, I used it to download all the CSV files located within each of the hot dog product pages. To do so, I had to:
- Scrape the links from the HTML code in the USDA website for each product. I had 9 pages of products to get through, each of them with roughly 50 products, so I had to obtain the base link I would need to download the data for each individual product.
- Build the actual individual links for each product that I am going to download.
- Download every single product data in CSV format.
- Clean the CSV format.
- Get some sleep. Haha, fooled you again didn’t? Sleep is for the weak!
This whole process is quite complex, so I’m only going to show you some screenshots of the step-by-step process so you get an idea of what it is like. First, I headed over to the first page containing hot-dog related product information, inspected the first product using Google Chrome, and found the body element that has all the products. This piece of HTML code will have the individual product codes – as they are coded in into this website – that I can later use to build my download URLs. I repeat this step for all 9 pages.
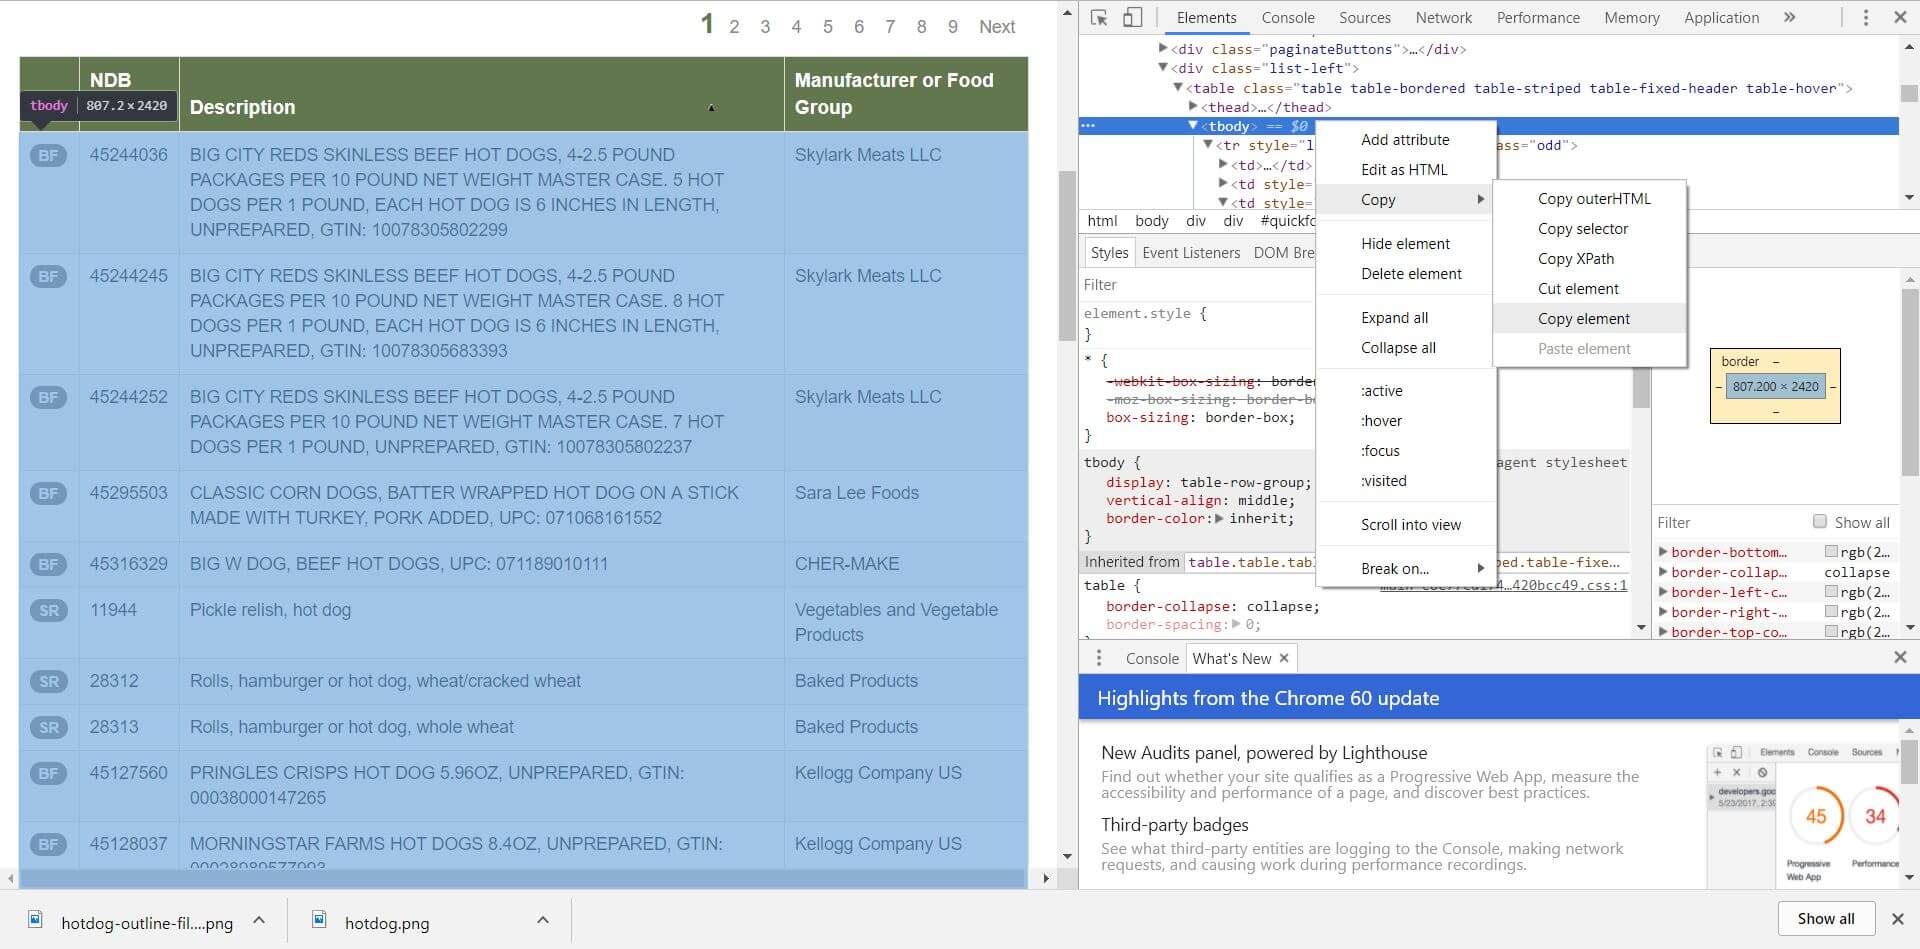
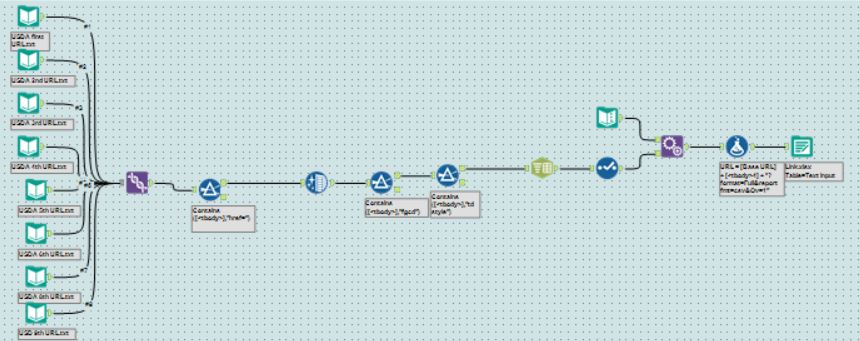
After pasting all these pieces of HTML code into notepad and turning them into text files, I unioned all of them into one file and extracted the piece of information I was interested in: the bit of HTML code with each of the products’ unique identifier. Here’s what that workflow looks like:
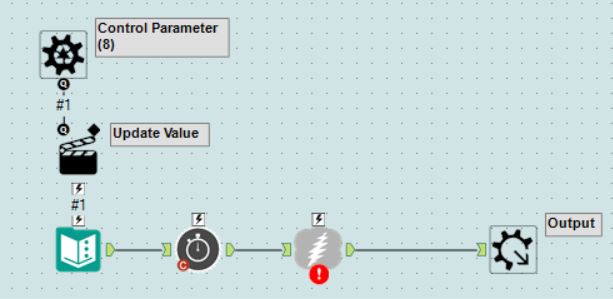
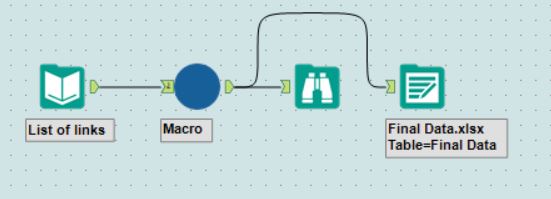
Now, I’m going to have to build my batch macro. This macro is quite simple: it’s simply going to iteratively replace the URL being called by my download tool every time the tool is done downloading the data from the link in one row. This way, I can automate the process of downloading the information for my roughly 500 products. I had to add a Wait a Second tool to delay my download tool, as the website wouldn’t let us make queries too rapidly and would only download a few rows of data. Here’s what that looks like:
After that, I’m going to combine the text file that has all my URLs with this macro to finally download all my product data:
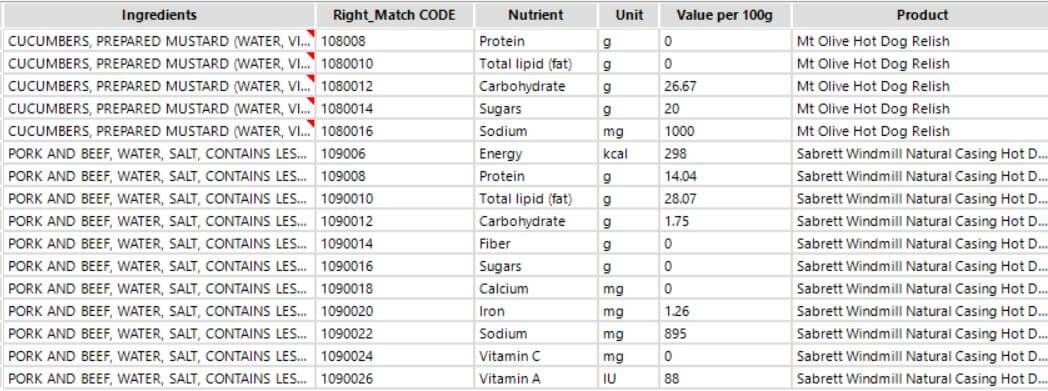
I now finally have all my CSVs and can start cleaning them up! Here’s a sample of what the data looks like when it arrived. It looks deceivingly clean, right? WRONG!

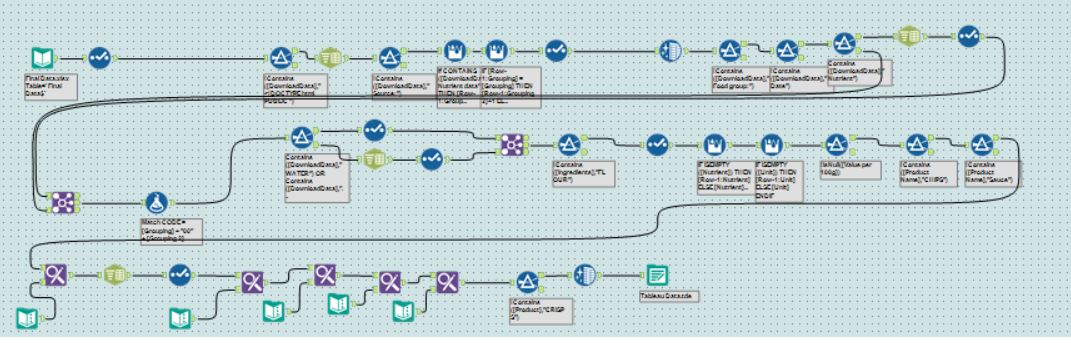
Now, unlike HTML or JSON files, Alteryx doesn’t have a tool that will allow you to automatically find structure in a CSV file. Instead, you are going to have to manually build rows, columns, parse them, rename them, filter things out, select columns, join things unto themselves, the whole works. Here’s what my final workflow looks like, and a sample of the data I finally managed to obtain.
Building the Dashboard, Thank God for Parameters
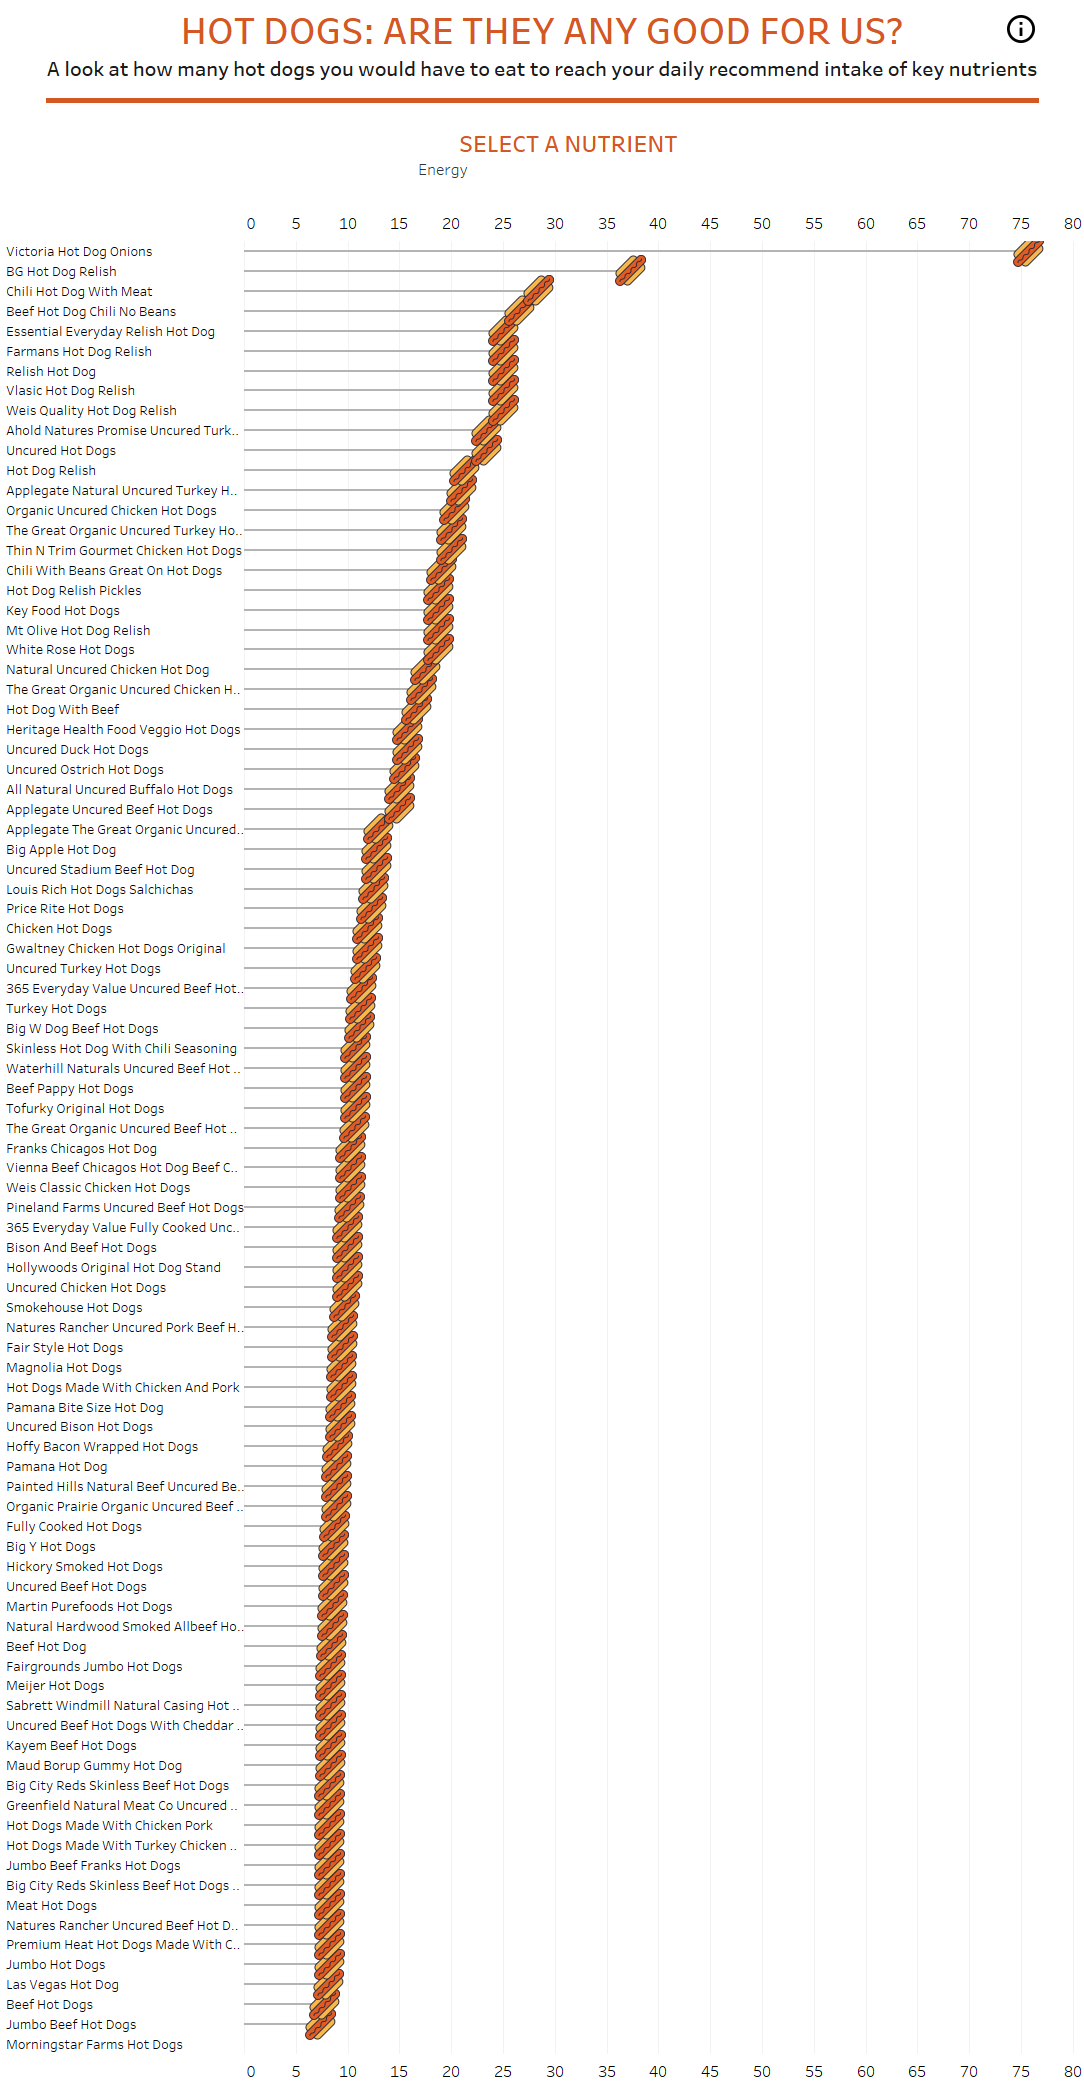
Before getting the data – which I only managed to get a clean working copy off by 6 pm – I really had no idea what visualization I was going to build. The data I had was quite basic, and there weren’t too many options to pick from. I ended up going off a simple question: how many hot dogs from each of these brands would I have to eat to get my daily intake of each of the nutrients in my dataset? I ended up removing the ones for which hot dogs have barely any nutrients to keep the viz clean, but I am pretty satisfied with the end result.
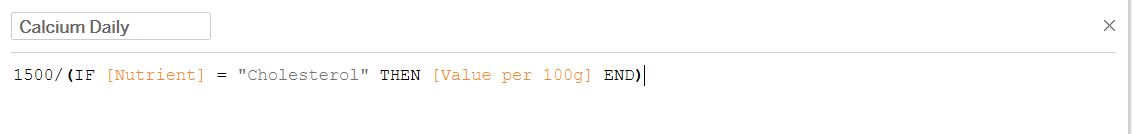
To figure out how many hot dogs it would take, I had to build an individual calculation for each of the nutrient types. I went online to find the recommended daily value for each of them and manually built out the following calculation for each of them (Value per 100g is my field that contains all the individual values for each nutrient for each product):
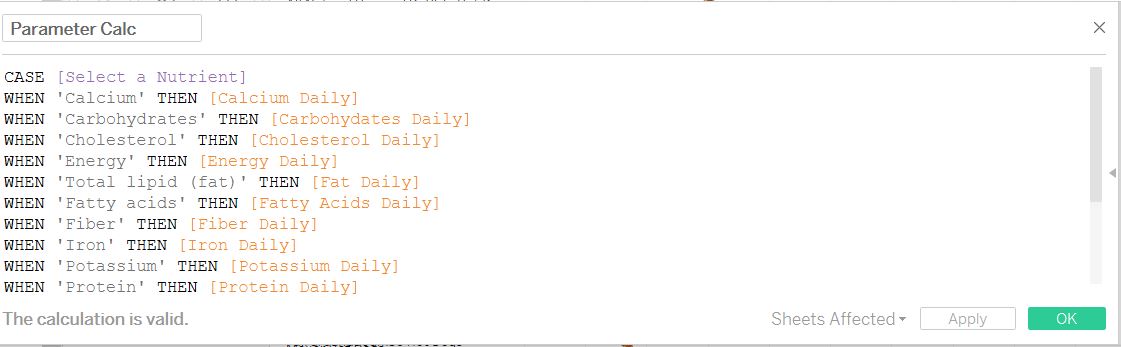
After that, I simply had to build a parameter that I could use to change what nutrient would appear in my chart as the user selected one. Here’s what that looks like:
After that, it was simply a matter of building my lollipop chart – which of course have a hot dog as a loli – and formatting the dashboard. Here’s what my final dashboard looks like! You can also check it out on my Tableau Public profile here.