Build your Team
Enhancing your data team with ours
Our consultants come armed with both technical and soft skills to support you to make the most of your data.

The Data School has been paramount to our success at JLL. It has allowed us to bring in highly skilled Tableau and Alteryx consultants. It saves considerable time trying to recruit contractors as I know their skills and training are to the highest standard. Over the past 5 years my team has developed analytical insights which have generated multi million dollar savings of which a considerable amount can be attributed to the Data School consultants we have had working on projects.
Paul Chapman, Global Director of Performance Management, BI and Innovation at JLL

Alteryx
Partner of the Year
EMEA
Tableau
Community Impact 2024
EMEA ESMB
DataIQ
Data for Good Champion
Finalist
DataIQ
Best Data Academy or Skills Development
Finalist

Alteryx
Partner of the Year
Europe

DataIQ
Data for Good Champion
Champion

Tableau
Data for Good 2021
EMEA
What our consultants are working on
We believe that sharing knowledge and expertise is key to driving innovation and growth in the data community. That's why we're excited to share our latest insights, tutorials, and industry trends with you through this blog.
Written by our team of experienced data consultants, these posts aim to solidify their own learning while giving back to the community.


Fri 01 Aug 2025 | Ted Evans
Dashboard Week Day 5: SQL, Snowflake and LEGO
So here we are, the final day of training! To wrap up a great four months of training. For our last ever training project, this saw us download LEGO catalogue data from Rebrickable, containing LEGO CSV files (sets, parts, colours, inventories, themes, etc


Mon 04 Aug 2025 | Eliza Hokanson
Power BI: Hack to Bring Marks to Front
After working on my Power BI rebuild for Dashboard Week, I just couldn’t let go of getting those selected countries to move to the front. This is where I left the dashboard


Sun 03 Aug 2025 | Younes Ghouini
MOM in Power BI - London Underground Temperatures
Recently, I took part in a Makeover Monday challenge using Power BI to further develop my data visualisation and analytical skills.

Fri 01 Aug 2025 | Stosh Sawicz
Dashboard Week Day 3 - Back to Basics!
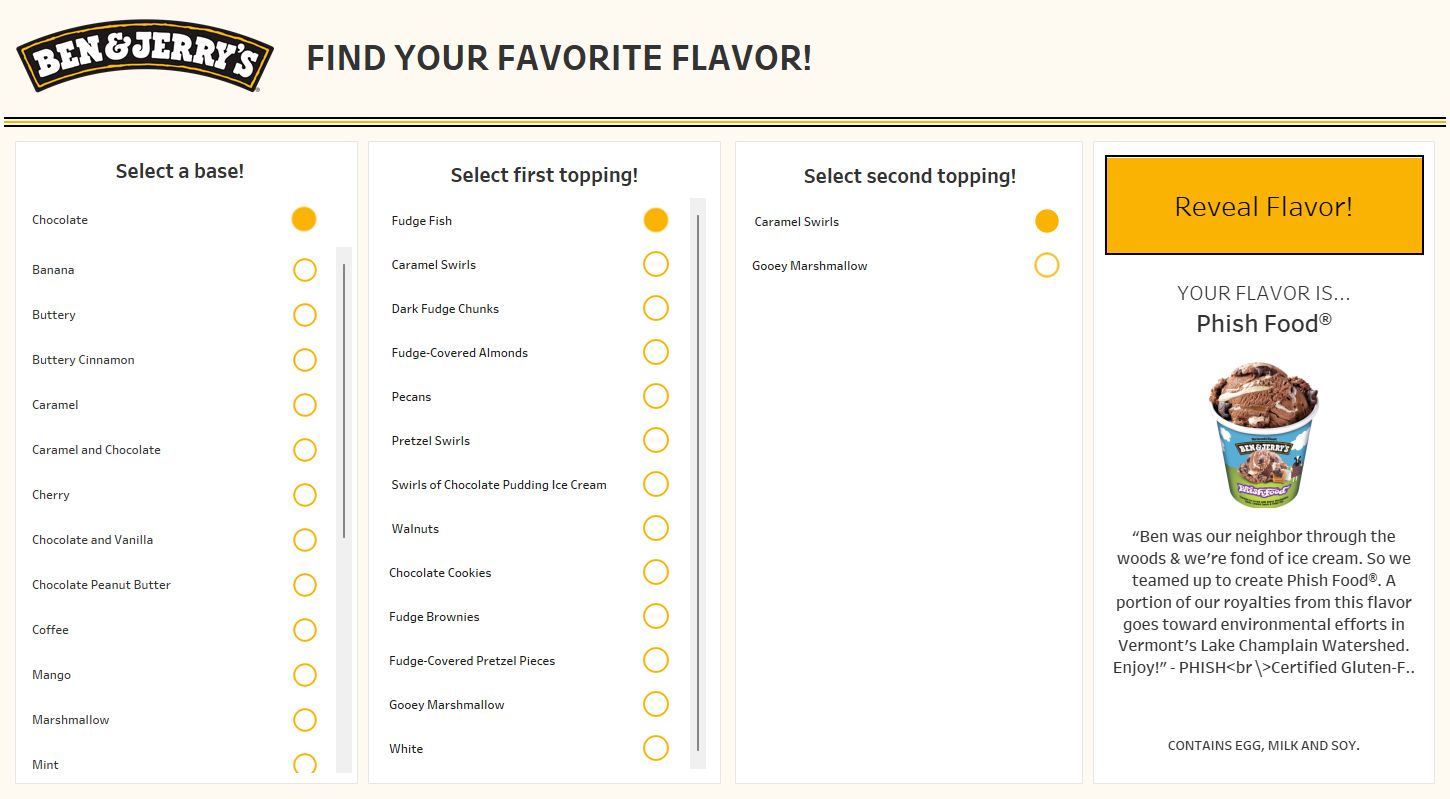
It is now day 3 of Dashboard week, our final day. Today, we were tasked with web-scraping the Ben & Jerry's website using Alteryx and create a clean visualization with the data in Tableau

Fri 01 Aug 2025 | Amanda Rodriguez
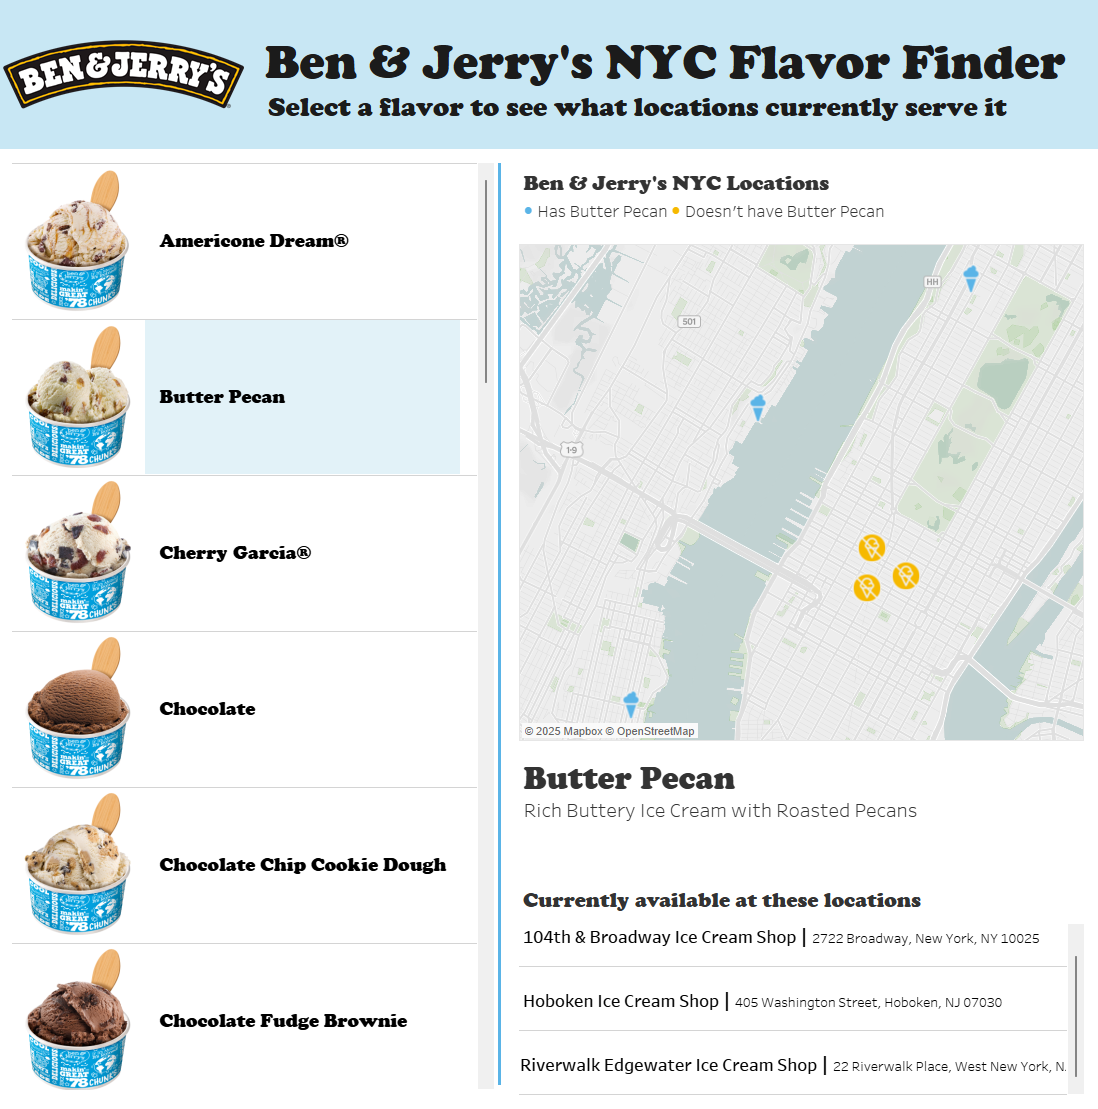
Webscraping for visuals: Creating a dashboard that explores allergens in Ben & Jerry's ice cream flavors
We're in the middle of the summer, so let's build a dashboard that allows a user to decide on a Ben & Jerry's ice cream flavor that is safe to eat if they have allergies.
Ben & Jerry's website is in HTML, so we should be able to gather a lot of information by webscraping via Alteryx

Fri 01 Aug 2025 | Gabriel Bryan
Dashboard Week 3: Tableau
It’s the last day of Dashboard Week! It’s been a pretty intense week, full of big projects and time crunches. I’ve had a lot of fun experimenting with different tools, but for the last day we took it back to Tableau
Fri 01 Aug 2025 | Eliza Hokanson
Dashboard of the Summer
DSNY9’s Dashboard Week was only three days, due to scheduling conflicts.
Day 1, we worked through rebuilding a Tableau dashboard in Tableau Next.
Day 2, we rebuilt a Makeover Monday project of our choosing using Power BI

Fri 01 Aug 2025 | Brandon Traditi
Dashboard Week: Day 3
Last Day!
It's crazy to be sitting here writing this blog on DSNY9's last day of training. I feel like the last 4 month were both so long yet went so fast


Fri 01 Aug 2025 | Louis Phipps
Dashboard Week Day 5: SQL, SQL, SQL
The final day of dashboard week has arrived, but it has not been very friendly.
It does make sense that the last day would be the toughest, and today definitely came with some challenges.
The Brief
We got provided with 12 tables all to do with lego sets

Fri 01 Aug 2025 | Miles Cumiskey
Dashboard Week Day 3 - Tableau
Day 3 of Dashboard Week was a really fun challenge.
We were given the Ben & Jerry's website and given free reign to make any form of dashboard we wanted! All we had to do was get the data ourselves


Fri 01 Aug 2025 | Agnes Amer
Lego meets Snowflake
The task for the final day of Dashboard Week involved uploading Lego data around the theme of Summer into Snowflake, and then cleaning, joining and creating views all in Snowflake. Once the views were created, the task was to create a dashboard using either Tableau or PowerBI


Fri 01 Aug 2025 | David Gandary
Automating Store-Level Reporting with Batch Macros in Alteryx
A macro in Alteryx is essentially a reusable workflow. Instead of repeating the same logic multiple times, you wrap it into a macro and call it when needed — just like a custom tool
Want to know more?
Whether you're planning for the future or you have a project that needs to get started next week our team are more than happy to help.
Complete our contact form with your name, company email and a brief message and we will get back to you as soon as we can.