


So here we are, the final day of training! To wrap up a great four months of training. For our last ever training project, this saw us download LEGO catalogue data from Rebrickable, containing LEGO CSV files (sets, parts, colours, inventories, themes, etc.) and visualise it, based on a summer theme!
The Challenge/Brief
Using a range of technologies and processes the challenge was to:
- Download all the tables and upload them individually to your own schema on Snowflake
- Clean, join and create views in Snowflake using SQL.
- Identify summer-themed LEGO sets and themes using keywords in the datasets.
- Analyze relationships between sets, parts, colors, and themes etc with a summer theme.
- Explore trends such as:
- Set releases over time
- Popular parts and colors
- Set sizes and part categories
- Explore trends such as:
The Process - Snowflake & SQL
After downloading 12 CSV files from Rebrickable, I was ready to use SQL in Snowflake in order to extract what I needed from those tables and join them together in a suitable manner. We were given the below schema from Rebrickable in order to access all of the data.
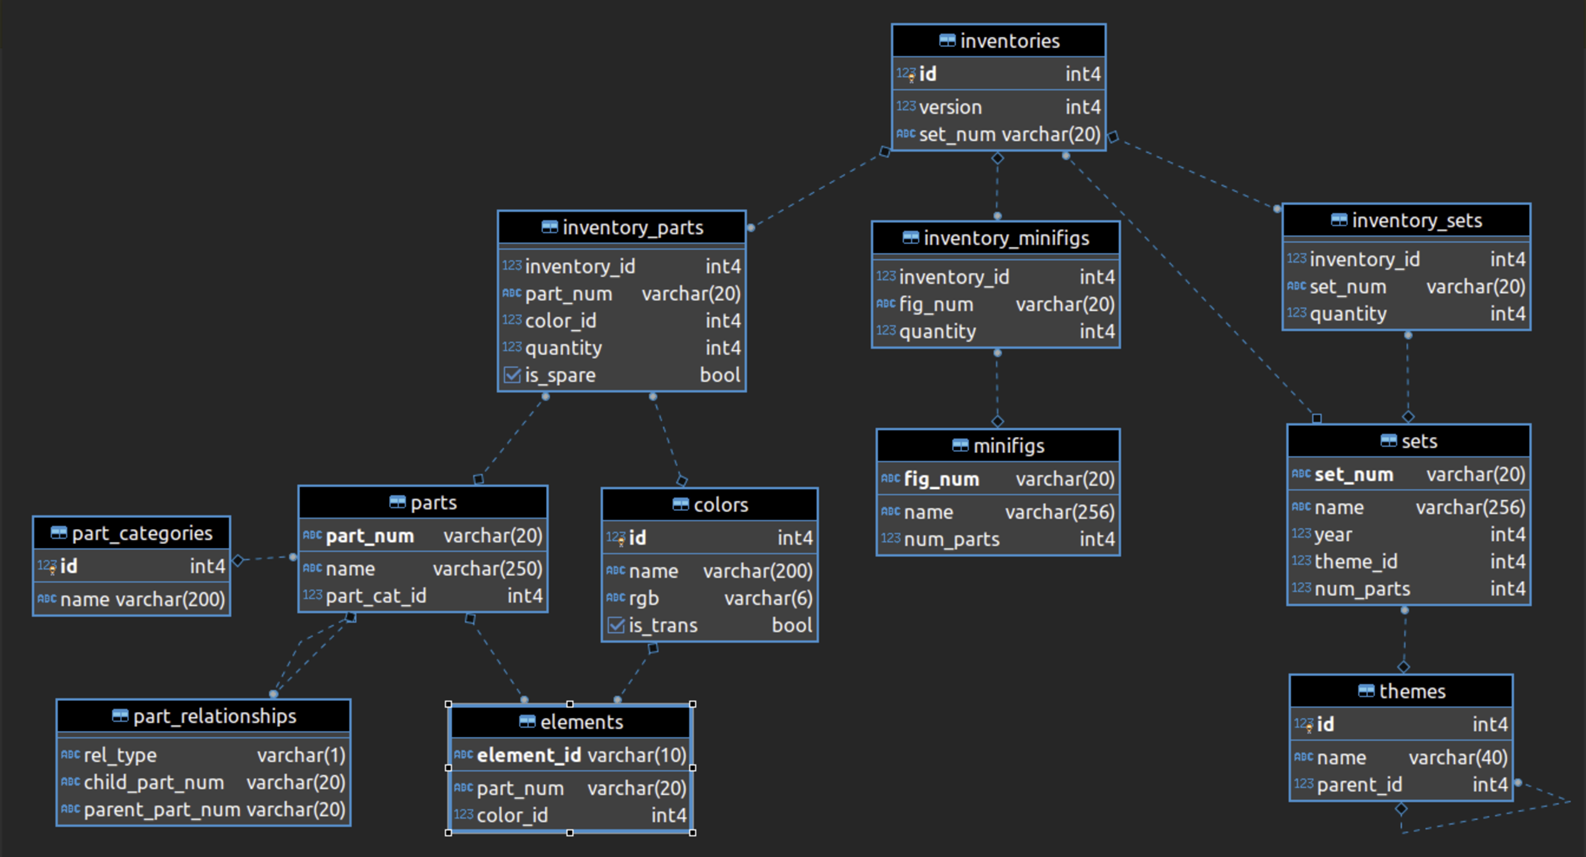
Using the common table of 'inventories', I decided to attack the data in 3 parts:
- Themes & Sets - where I could filter to my chosen theme ("Beach")
- Minifigs
- Parts, Colours, Categories & Inventory parts
I used the following SQL queries to extract the data I wanted for each part:
- Themes & Sets
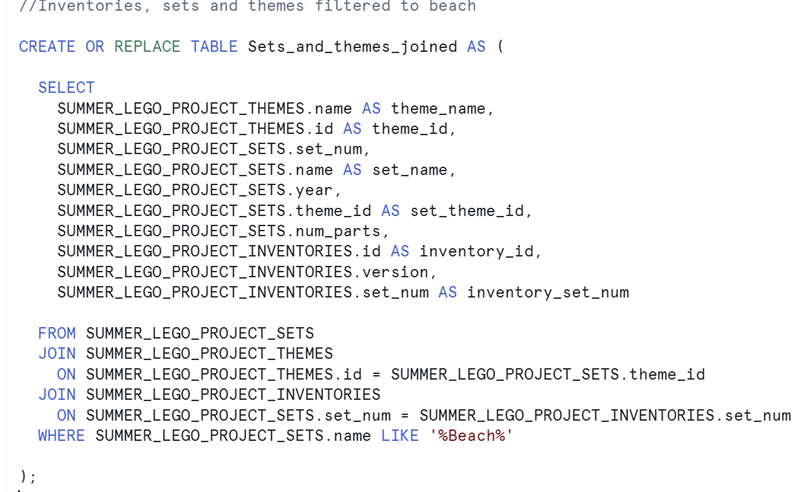
//Inventories, sets and themes filtered to beach
CREATE OR REPLACE TABLE Sets_and_themes_joined AS (
SELECT
SUMMER_LEGO_PROJECT_THEMES.name AS theme_name,
SUMMER_LEGO_PROJECT_THEMES.id AS theme_id,
SUMMER_LEGO_PROJECT_SETS.set_num,
SUMMER_LEGO_PROJECT_SETS.name AS set_name,
SUMMER_LEGO_PROJECT_SETS.year,
SUMMER_LEGO_PROJECT_SETS.theme_id AS set_theme_id,
SUMMER_LEGO_PROJECT_SETS.num_parts,
SUMMER_LEGO_PROJECT_INVENTORIES.id AS inventory_id,
SUMMER_LEGO_PROJECT_INVENTORIES.version,
SUMMER_LEGO_PROJECT_INVENTORIES.set_num AS inventory_set_num
FROM SUMMER_LEGO_PROJECT_SETS
JOIN SUMMER_LEGO_PROJECT_THEMES
ON SUMMER_LEGO_PROJECT_THEMES.id = SUMMER_LEGO_PROJECT_SETS.theme_id
JOIN SUMMER_LEGO_PROJECT_INVENTORIES
ON SUMMER_LEGO_PROJECT_SETS.set_num = SUMMER_LEGO_PROJECT_INVENTORIES.set_num
WHERE SUMMER_LEGO_PROJECT_SETS.name LIKE '%Beach%'
);
- Minifigs
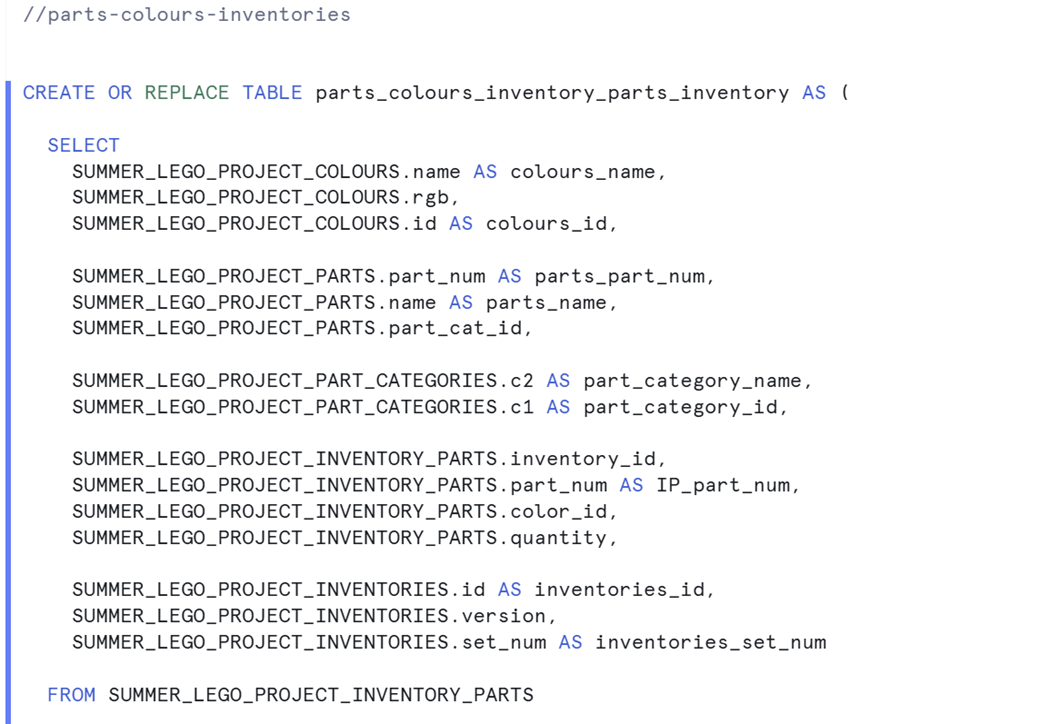
CREATE OR REPLACE TABLE parts_colours_inventory_parts_inventory AS (
SELECT
SUMMER_LEGO_PROJECT_COLOURS.name AS colours_name,
SUMMER_LEGO_PROJECT_COLOURS.rgb,
SUMMER_LEGO_PROJECT_COLOURS.id AS colours_id,
SUMMER_LEGO_PROJECT_PARTS.part_num AS parts_part_num,
SUMMER_LEGO_PROJECT_PARTS.name AS parts_name,
SUMMER_LEGO_PROJECT_PARTS.part_cat_id,

SUMMER_LEGO_PROJECT_PART_CATEGORIES.c2 AS part_category_name,
SUMMER_LEGO_PROJECT_PART_CATEGORIES.c1 AS part_category_id,

SUMMER_LEGO_PROJECT_INVENTORY_PARTS.inventory_id,
SUMMER_LEGO_PROJECT_INVENTORY_PARTS.part_num AS IP_part_num,
SUMMER_LEGO_PROJECT_INVENTORY_PARTS.color_id,
SUMMER_LEGO_PROJECT_INVENTORY_PARTS.quantity,

SUMMER_LEGO_PROJECT_INVENTORIES.id AS inventories_id,
SUMMER_LEGO_PROJECT_INVENTORIES.version,
SUMMER_LEGO_PROJECT_INVENTORIES.set_num AS inventories_set_num
FROM SUMMER_LEGO_PROJECT_INVENTORY_PARTS
JOIN SUMMER_LEGO_PROJECT_COLOURS
ON SUMMER_LEGO_PROJECT_INVENTORY_PARTS.color_id = SUMMER_LEGO_PROJECT_COLOURS.id
JOIN SUMMER_LEGO_PROJECT_PARTS
ON SUMMER_LEGO_PROJECT_INVENTORY_PARTS.part_num = SUMMER_LEGO_PROJECT_PARTS.part_num
JOIN SUMMER_LEGO_PROJECT_PART_CATEGORIES
ON SUMMER_LEGO_PROJECT_PARTS.part_cat_id = SUMMER_LEGO_PROJECT_PART_CATEGORIES.c1
JOIN SUMMER_LEGO_PROJECT_INVENTORIES
ON SUMMER_LEGO_PROJECT_INVENTORY_PARTS.inventory_id = SUMMER_LEGO_PROJECT_INVENTORIES.id
where SUMMER_LEGO_PROJECT_PART_CATEGORIES.c1 <> 'id'
)
;
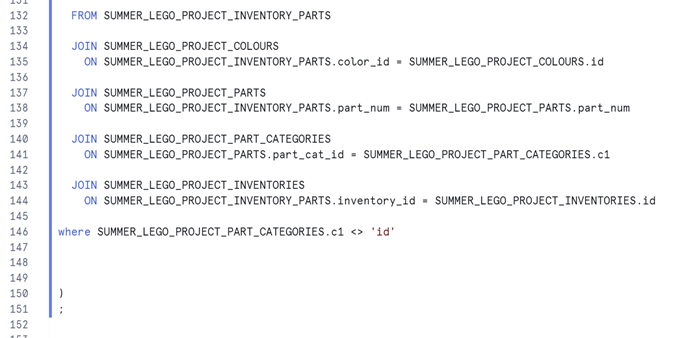
- Parts, Colours, Categories & Inventory parts
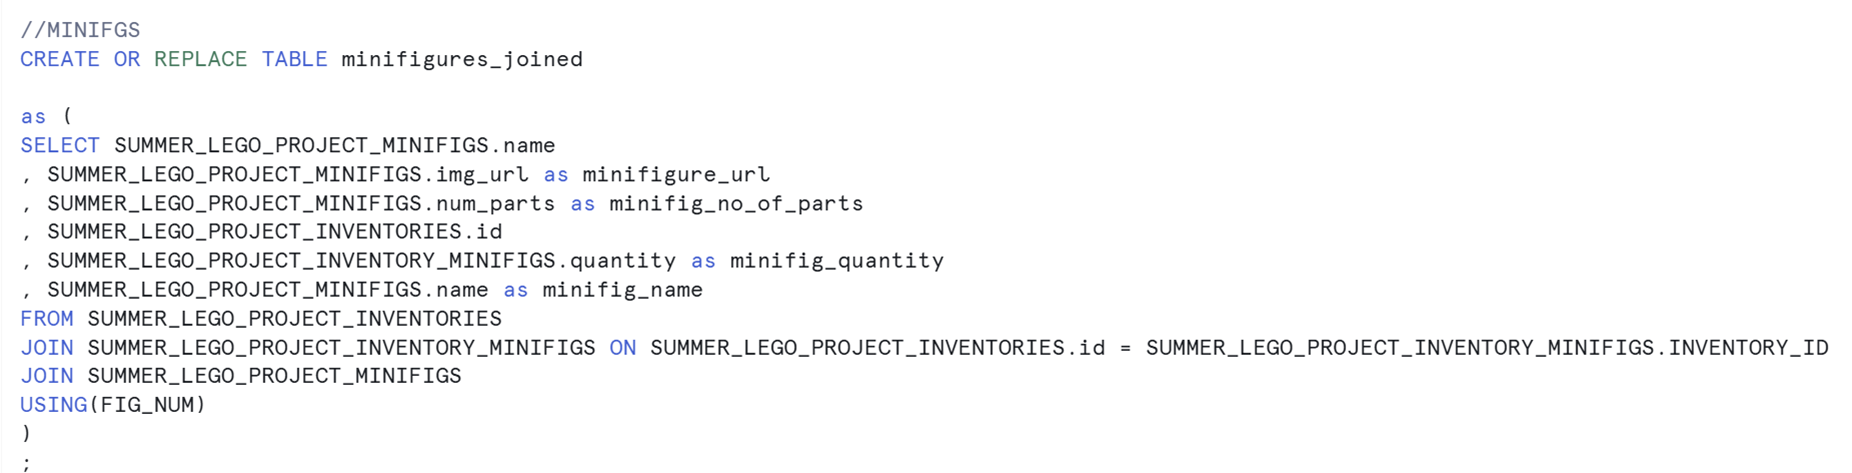
//MINIFGS
CREATE OR REPLACE TABLE minifigures_joined
as (
SELECT SUMMER_LEGO_PROJECT_MINIFIGS.name
, SUMMER_LEGO_PROJECT_MINIFIGS.img_url as minifigure_url
, SUMMER_LEGO_PROJECT_MINIFIGS.num_parts as minifig_no_of_parts
, SUMMER_LEGO_PROJECT_INVENTORIES.id
, SUMMER_LEGO_PROJECT_INVENTORY_MINIFIGS.quantity as minifig_quantity
, SUMMER_LEGO_PROJECT_MINIFIGS.name as minifig_name
FROM SUMMER_LEGO_PROJECT_INVENTORIES
JOIN SUMMER_LEGO_PROJECT_INVENTORY_MINIFIGS ON SUMMER_LEGO_PROJECT_INVENTORIES.id = SUMMER_LEGO_PROJECT_INVENTORY_MINIFIGS.INVENTORY_ID
JOIN SUMMER_LEGO_PROJECT_MINIFIGS
USING(FIG_NUM)
)
;
Snowflake/SQL reflections
Having not done SQL/Snowflake for a good few weeks, this was a but of a shock to the system however I really want to sharpen my skills in this area, so it was a welcomed challenge. And to start with it definitely was a challenge! However, the more I got into the groove and got reacquainted with SQL and some of my prior notes, I managed to write successful queries and pull data out into tables/views - which was more of the problem, trying to navigate snowflake after not using for a few months now. I definitely want to use these skills again and in the future, so I'll work on some personal projects to enhance my skills and will be looking out for some experience through placements.
Dashboarding - Plan and execution
Plan
I always plan my dashboards as I feel it gives me more clarity and structure as to what I am actually building and how it will help my stakeholder/client. So, with the client's brief in mind, and with 3 main bullet pointed areas, I decided to make a three part dashboard, one section for each bullet point and answer their questions through respective sections. I wanted the dashboard to be fairly analytical, with a mix of design as after all it is dashboard week! So, I came up with the following sketch:
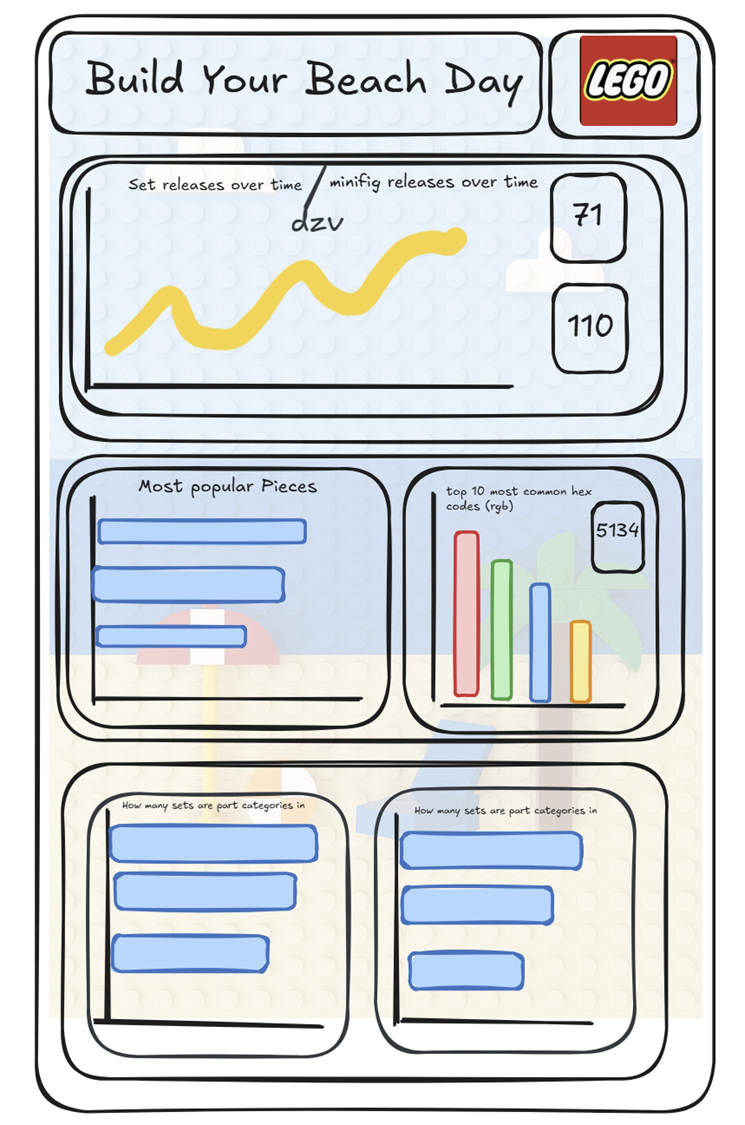
It's a rough sketch but clearly has three sections to highlight three of the bullet points and the questions associated. I also wanted to incorporate a lot of interactivity as the client asked for this, so I wanted to have some DZV (dynamic zone visibility), to show different graphs and views based on the users choice - in order to provide supplementary insights.
Dashboard execution
So, how did it actually go? In the time I had left (~1hr), I managed to deliver what the client asked for, and answer all their questions. Unfortunately time was too short to add some DZV and some supplementary graphs to the dashboard - but I did manage to make them, so I told the stakeholder these would be my next steps and wouldn't actually take me too long post the presentation. Here's what I managed to come up with:
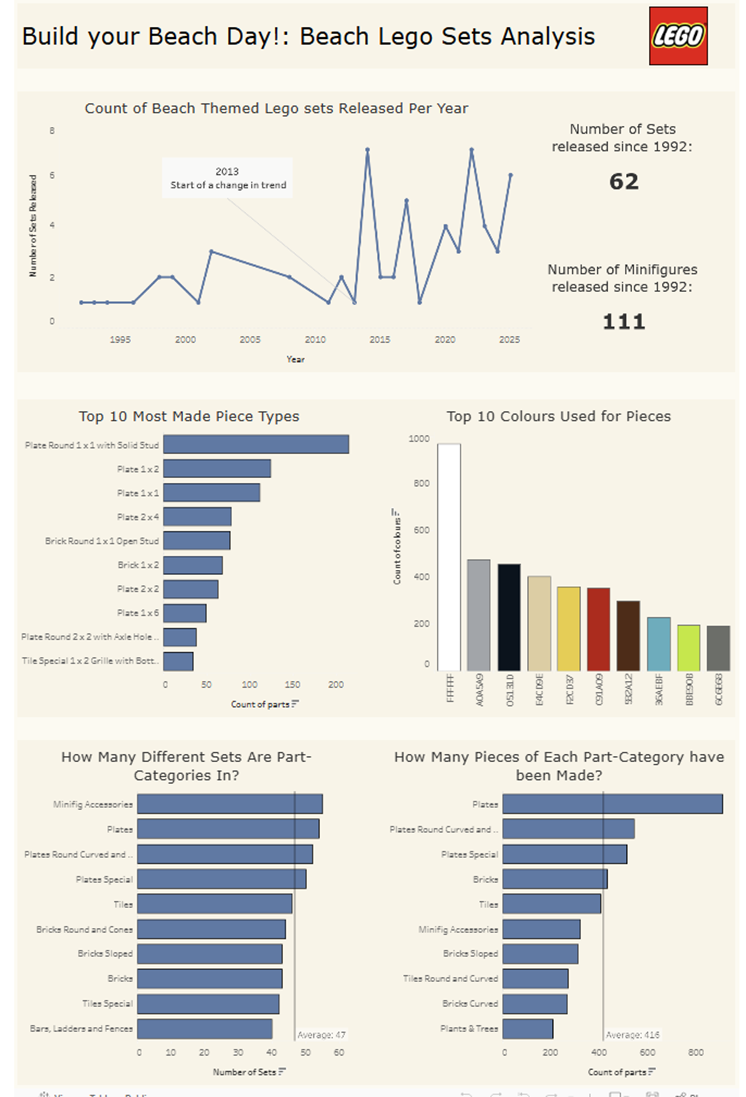
I stuck fairly to the plan and I'm happy with what I made considering that all the graphs and interactive and filter based on which bar you select for example:
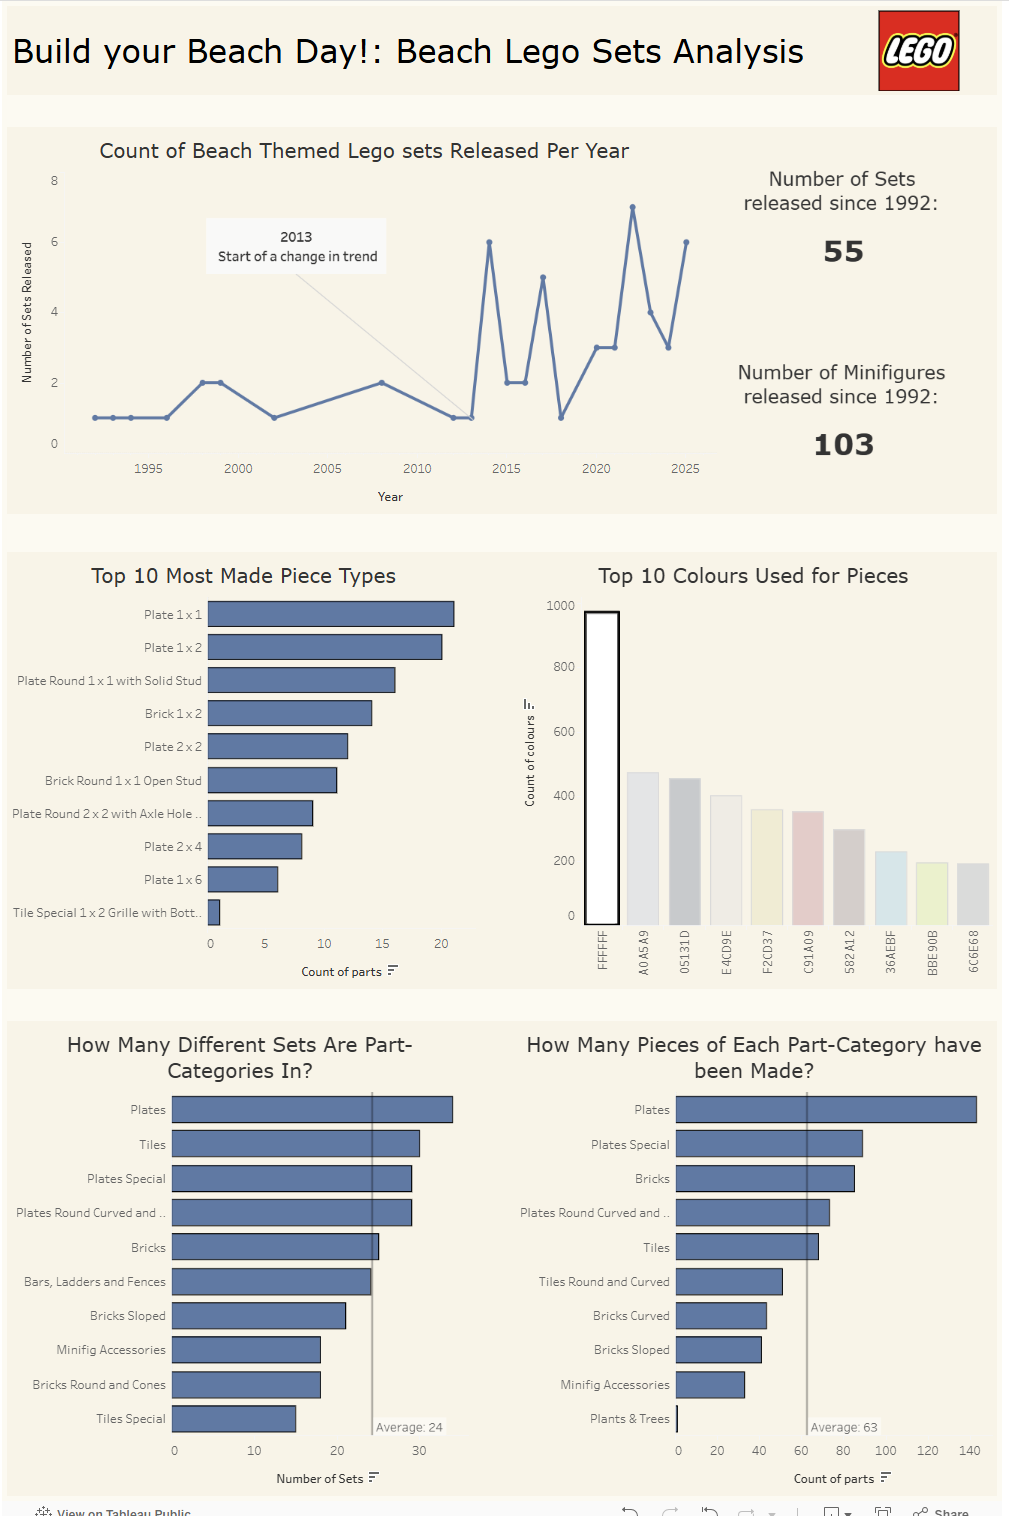
The dashboard will change based on LEGO pieces with the white colour.
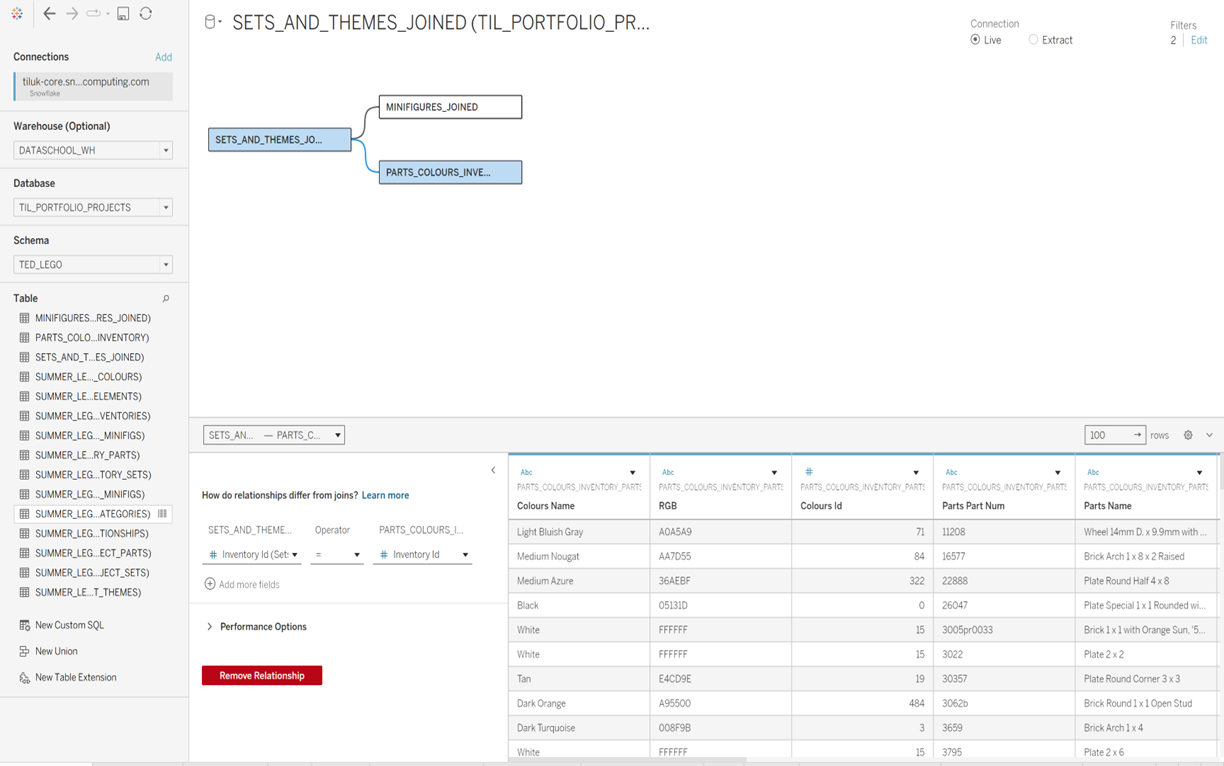
Setting up the Dashboard/Data
In order to use all the data, as I created 3 tables, I needed to relate each table together in the Tableau data source pane. I did this by relate all the data sources on Inventory ID, as seen in the below image:
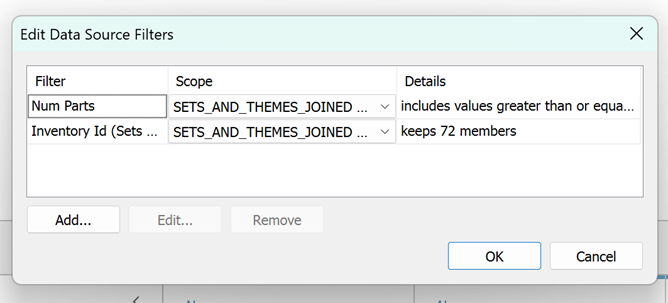
One thing I also needed to do for the dashboard was add data source filters, as in the 'beach' dataset I had managed to get there were a few different sets which actually had zero pieces in them. Therefore, I thought suitable to exclude them, hence need to apply the following data source filter:
Challenges
The main challenges I faced during the day, was time pressure. Having to jump back into SQL mode in order to pull through the data I wanted, took a little minute to get familiar again, as previously mentioned, but once I began to get stuck in, it all came flooding back. However, the whole SQL process of firstly planning what I wanted to make the dashboard on and how I was going to do this, as well as actually executing the process meant by the time I was finished - there wasn't too much time left for dashboarding - around 1 hr. I am happy with what I managed to make in the limited time - it is a fully functioning, interactive dashboard with a clean design, however there was so much more I wanted to do with the dashboard. I'll have to revisit this one day to improve the dashboard and fulfil the original plan.
Links
Dashboard: https://public.tableau.com/app/profile/ted.evans/viz/LegoBeachsetsDashboard/Dashboard1?publish=yes
Slide Deck:
Github SQL:
 Tedevans562
A fun challenge all in all and a great way to consolidate my learning over the past 4 months - what a journey it's been! Thanks for reading and looking forwards to the next 2 years...