For Day 2 of our dashboard week we were tasked with producing an analytical dashboard to look into Tobacco use in the US using data from the "Tobacco Use Supplement" Current population survey.
Data Prep:
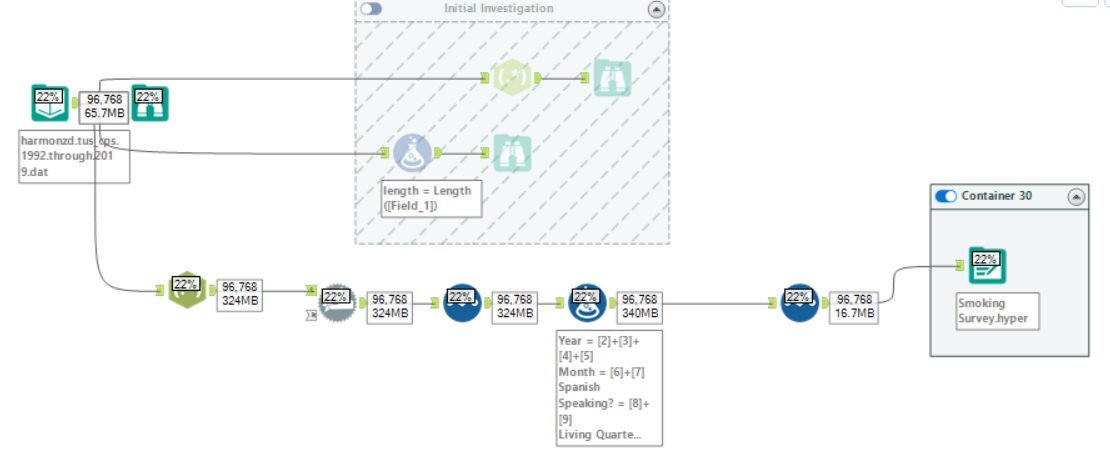
The data was initially only available in SAS format which raised some initial issues mainly centered around how to get the data into Tableau in order to visualise it. Having very limited knowledge of SAS as well as finding out that Tableau cannot read in .sas files meant that we had to find a workaround to get the data in a useable format.
The most successful solution seemed to be to input the data into alteryx as a fixed width text string which would then have to be parsed manually. This wasn't too complicated but did involve quite a lot of tedious manual entry into formula tools.
The method was essentially to split out the data to 1 column per character using regex (as each survey response was exactly the same number of characters) and then join the answers back together on a question by question basis as needed.

I chose to only use a few fields as it would have taken too long to include all of them and would also have made for a pretty unweildy dataset with a huge number of columns.
Dashboard:
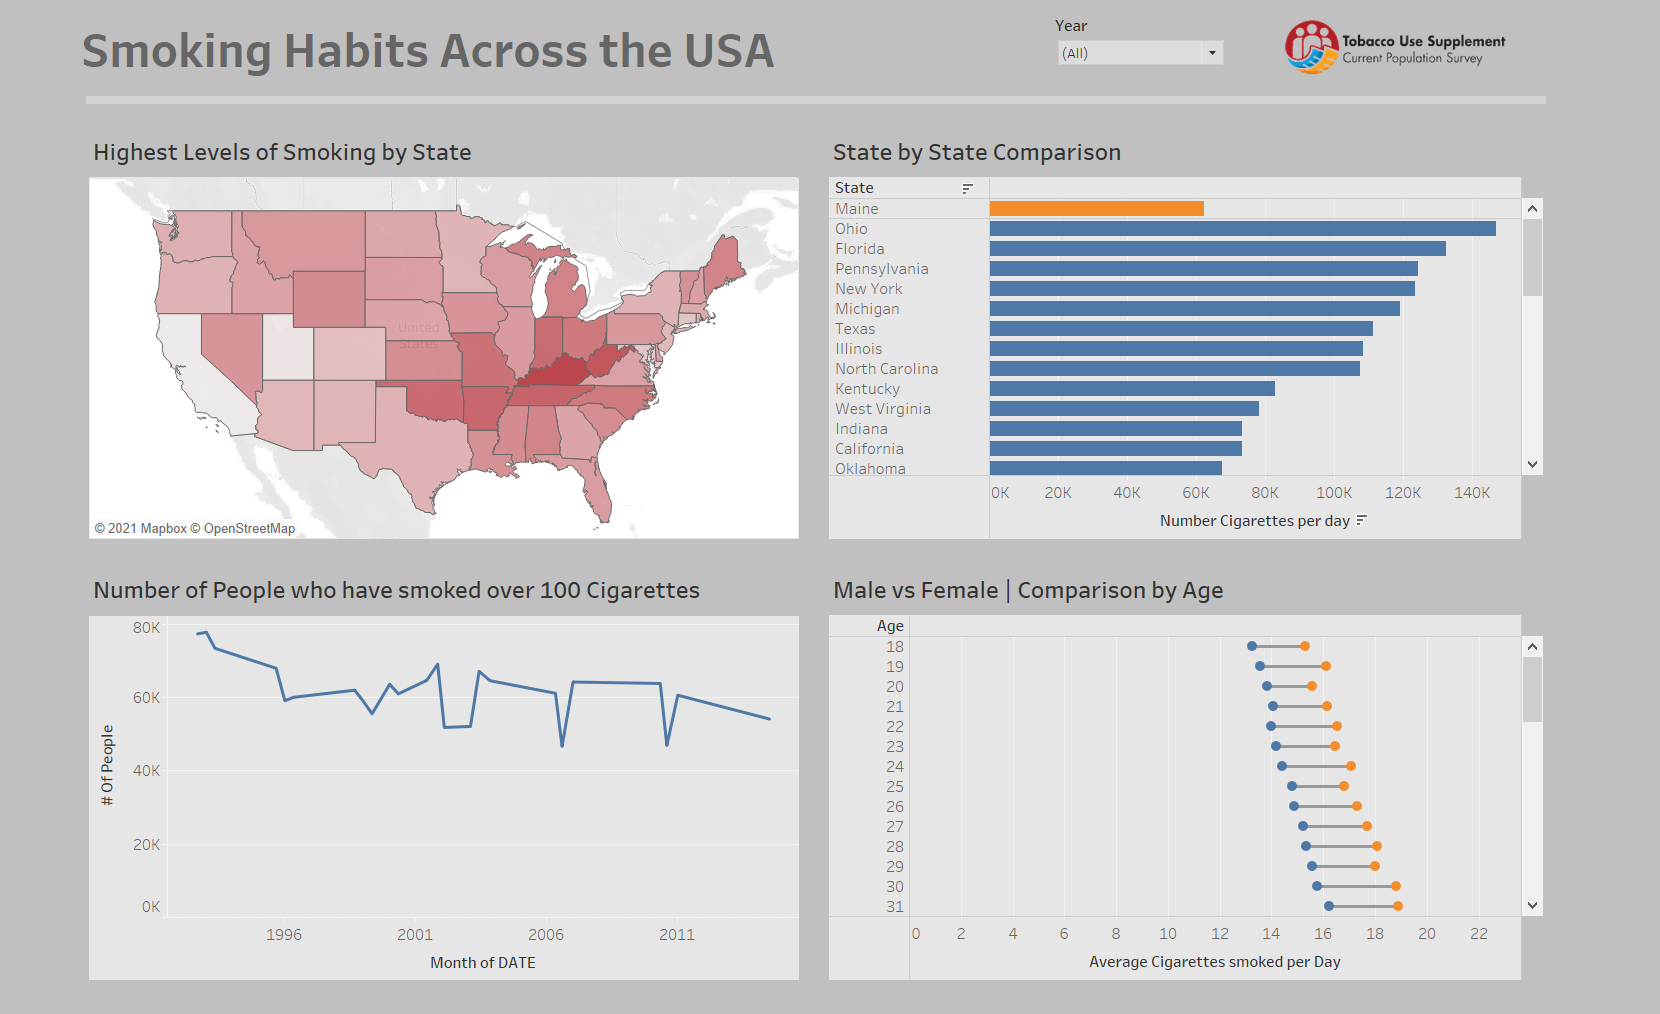
I didnt have too much time to create a dashboard after all of the data prep was completed but the main things I wanted to look at were just the basic variables such as Age, Gender and Location.
Main findings include that the eastern states tend to smoke more that the western states (especially low rates in california and Utah), Men smoke more than women and (unsurprisingly) - smoking rates are declining.
Final Dashboard:

