Tooltips are a brilliant way in Tableau to offer extra insight into what your visualization is showing. Having a dynamic tooltip allows users the same flexibility in tooltips that they’d see elsewhere on their dashboards.
In this example I’ve used Tableau Superstore, and given the functionality to choose between displaying Sales or Profit per Region.
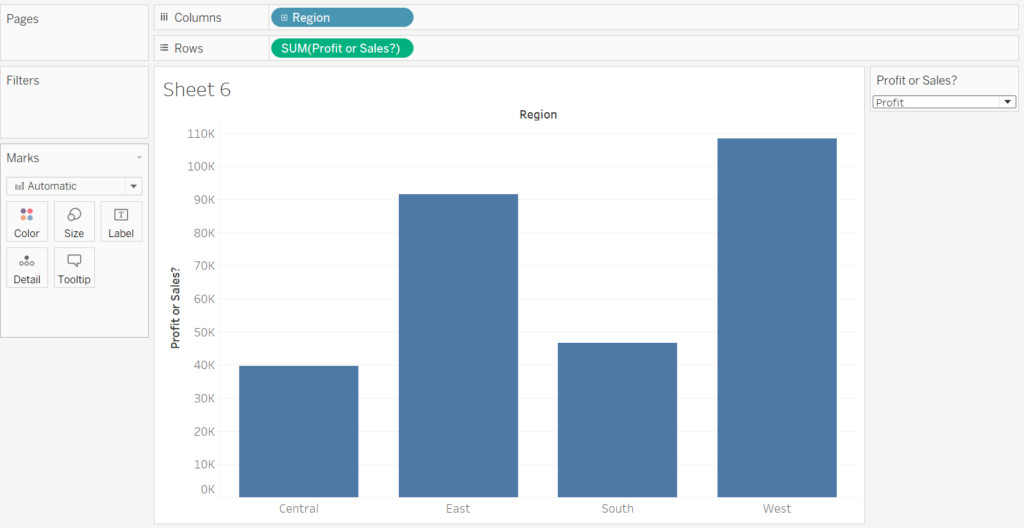
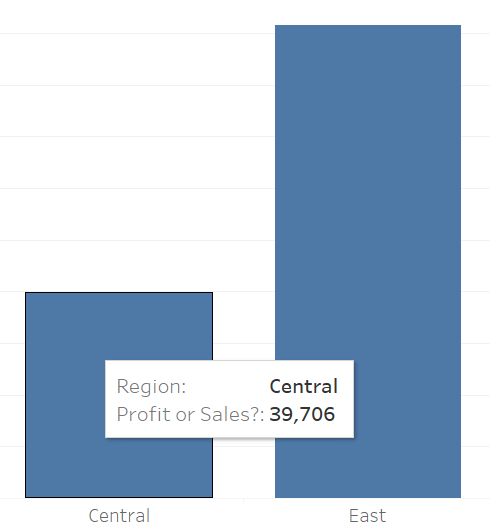
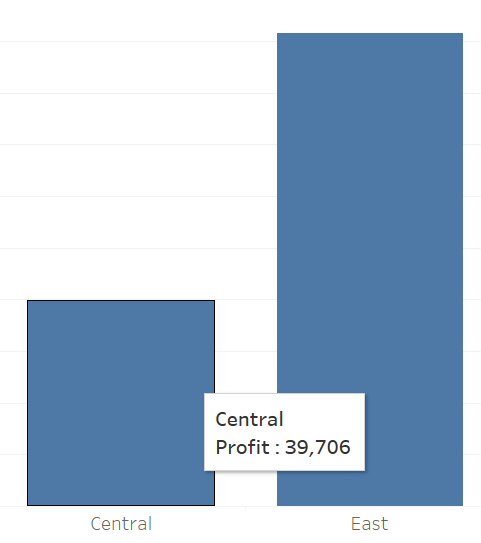
The default Tooltips for this chart leave a lot to be desired, and crucially don’t differentiate to show whether Profit or Sales have been chosen.
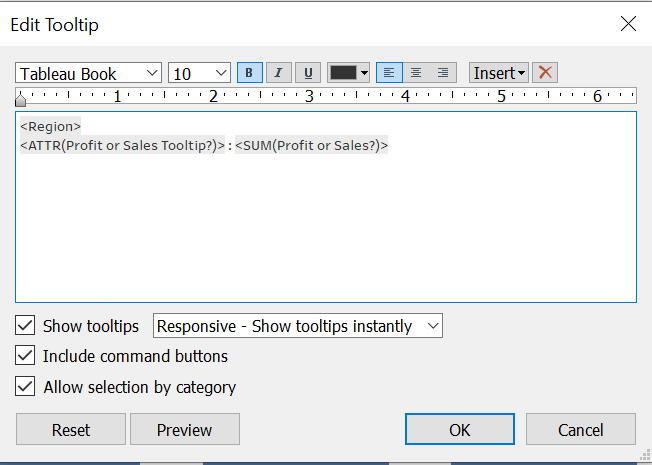
Creating a new calculated field, and adding this field to the tooltips shelf I created a dynamic tooltip!
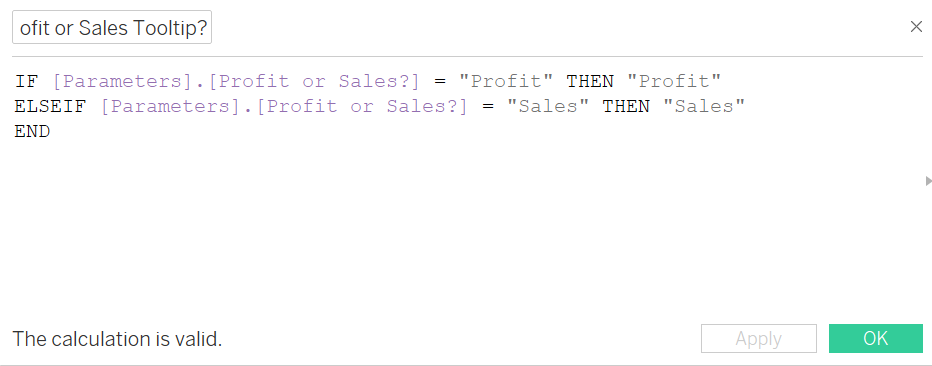
This calculated field will display “Profit”, when profit is selected in the parameter, and “Sales” when sales is selected.
I hope you found this short description of how to create dynamic tooltips useful.