


The Tableau Data Analyst exam is a certification "intended for individuals who enable stakeholders to make business decisions by understanding the business problem, identifying data to explore for analysis, and delivering actionable insights". Or more simply, you know what you're doing and want to have a certification that proves it.
In this blog, I will provide an overview of the exam, and share some useful advice and tips I learnt along the way of studying for the certification.
How does it work?
As of December 2025, the exam contains 60 multiple choice questions (including 5 non-scored) over the course of 1 hour 45 minutes. It has a passing score of 65%, and has different content sections to the exam that cover Tableau Prep, Desktop and Server. It's broken down in to 4 different categories with different weightings. If you want to read more about what each section contains, scroll down to the Content section here.
- Connect to and Transform Data: 24%
- Explore and Analyse Data: 41%
- Create Content: 26%
- Publish and Manage Content on Tableau Server and Tableau Cloud 9%
Topics to Focus On
Whilst having a good all round understanding of all the Tableau software's is important, the exam does have focus on some areas you may not have focused on during training or your self learning for the exam.
Disclaimer: This is NOT the only content that you need to know for the exam. Rather, this focuses on topics that appear more than others, or from my own personal training felt needed more attention than I would have assumed for the exam and what I find important when using Tableau practically.
Here are some that I found to come up quite often that would prove prudent to cover.
General Advice
- Study the Order of Operations within Tableau.
- Know what Web Data Connectors are.
- Reference Bands: What they show, how to implement them, the different types.
- Default join of a blend.
Difference between Dimensions and Measures
- Dimensions are fields that categorise data, a qualitative field
- Measures are quantifiable, can be aggregated and is numeric.
LODs
- Using Include LODs
- When aggregating something as a normal aggregate, it allows us to consider/not consider different variables.
- Happen after dimension filters, can compare to different levels of details such as state or region.
- Using Exclude LODs
- Let you remove on or more dimensions from the level of detail used in a calculation.
- { EXCLUDE [Dimension] : AGG([Measure]) } would specify the dimension to remove from the calculation, and what aggregation you would like to perform.
- LODs in an IF statement, identifying correct formatting of a calculation.
- Context Filter LOD: Creating the LOD then adding to context, or learning to specify inside the calculation itself.
- Nested LOD logic, and being able to read. Example below:
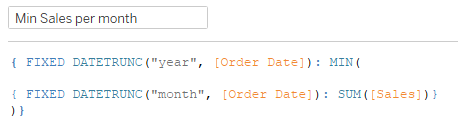
Table Calculations
- The way a table is calculated depends on the partitions and the special dimensions.
- Partitions are dimensions that define how to group a table calc. Generally the first dimensions are in the rows or columns panel
- Specific dimensions: What you select defines the calculation in this way. Interpret it as "for every unticked dimension, calculate the Running Type, from Ticked items (bottom to top).
- Types of Table Calculations
- Moving average
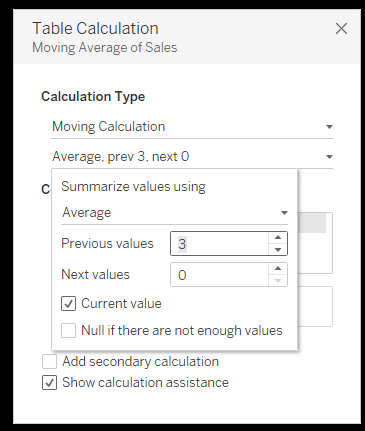
- It calculates the average for the specified period. The windows average is not averaging at the row level, but rather at the category level for the section that is specified. Specifying the period needs to be done with caution. Ticking the current value means that the current month or week of sales would be included in the window average. The previous values decide how far back the window must look. For example if we looked at Sales on a monthly basis and know that the current month is December, previous values of 3 would mean it would include, September, October and November. If we want December included, we tick current values, if not, deselect. Of course, this is where deciding on if a 3 month rolling average includes the current month, must be carefully considered.
- Moving average
- Percentage of total
- Table across, everything across adds up to 100%.
- Table down, everything down adds up to 100%.
- Rank
- Returns the rank of a value within a specified partition. There are different types.
- Rank() - 1,2,2,4... skips numbers after a tie.
- Rank_Dense() - 1,2,2,3... does not skip numbers after ties.
- Rank_Modified() - 1, 2.5, 2.5, 4... gives average rank to ties.
- Rank_Unique() - 1,2,3,4... always gives a unique rank even if values are tied, assigned arbitrarily
- Rank_Percentile() - 1, 0.75, 0.75, 0.5.... returns a percentile (0-1) instead of a rank position
- Returns the rank of a value within a specified partition. There are different types.
- Index
- Returns the position of a data point within a partition, or its row number.
File Types
- File type outputs and outputting published data sources.
Prep
- Working on an output from an unfinished Prep Flow.
- At which step can you union multiple files together as an input, in Prep and Desktop.
- Within Desktop, how you pivot, promote to headers, join tables, create relations
Filters
- How to reset a sheet to no longer ignore actions.
- Row Level Security: Do you set up the filter as a dimension in the data source filter or the dimension filter?
Server
- General best practice. Some examples of question topics are turning Excel files in to extracts/scheduling, and how & when to embed credentials.
- Publishing workbooks
- Publishing data sources
- Managing user permissions
- Managing subscriptions
- Web authoring
Stories
- What they are, how they work, how to setup.
Data Calculations
- Calculate the first Monday (or otherwise) of the month.
Layout/Formatting
- How to set a container with the same height and width.
- How to identify floating containers from a screenshot of the dashboard hierarchy.
- How to hide chart tiles when exporting dashboard as a PDF.
Difference between SUM() and TOTAL()
- SUM() adds values within a current partition based on the dimensions in the view, whereas TOTAL() adds values over the entire table and ignores row-level partitions unless it is modified in the table calculation.
Reference Bands/Lines
- Understanding where to find them (analytics panel, drag on to visual).
- Understanding the different setups you can have, such as Table, Pane or Cell.
Annotations
- Right click mark, annotate the mark, point or area if you want
Resources
This section will discuss
- Get Tableau Certifications Practice Exam - Good set of questions that are similar to the style of questions asked during the exam. This practice simulation has 36 questions with 2 hours of allocated time.
- Trailhead Cert Prep - This has different modules that focus on the key exam topics, with each covered in it's own unit. It has an overview of the exam policies and structure, with a quiz to run through questions.
- ExamGPT - Built by one of TIL's own, Will Stokes, this GPT gives you the chance to request questions that you want testing on, and it will generate questions based on that topic for you to answer. This is really helpful in practicing the style of question you will encounter, although it does occasionally have some ambiguous descriptions some of the answers.
- Key Topics Overview - This webpage provides the best breakdown of content you need to know for each section in your exam, and will help you keep track of what you may need to revise.
- Data School Blogs - Always a useful resource, if you are looking for an in depth explanation on pretty much any topic, search for it here!