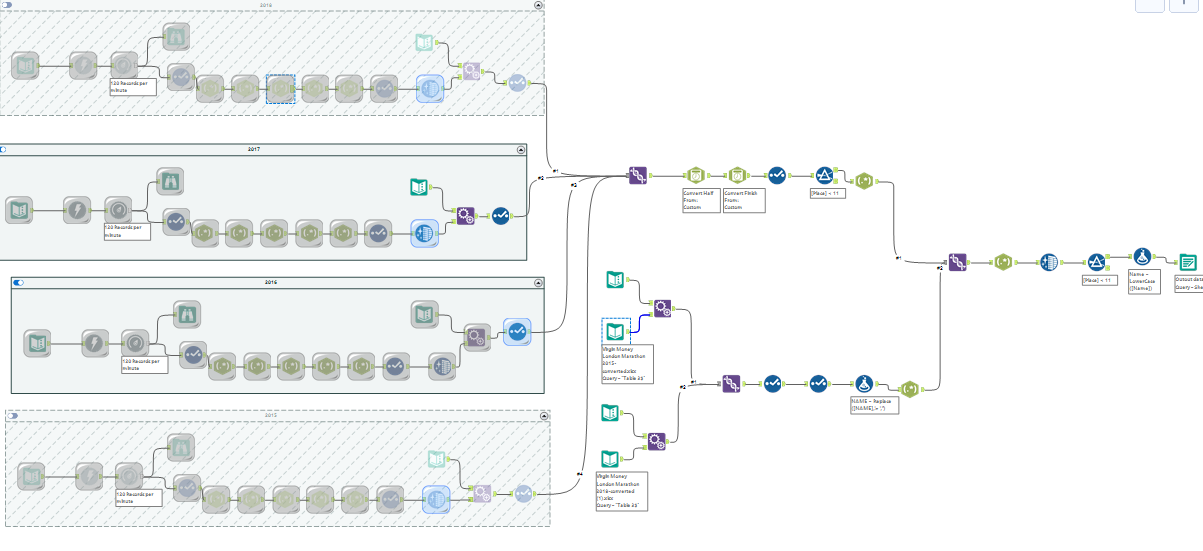
For todays challenge we were given a link to the database of the London Marathon, with 8 years worth of data to download. This one was tricky as there was no way of exporting this and it would require web scrapping to retrieve. The scrapping part proved very difficult as some years had different formatting, and the web address was missing key info on the years that only had one page of data due to the way it was setup. This was an issue as the downloaded HTML would be missing some of the key parameters such as the event category. I was fairly limited on prep time as I had a meeting in the morning and had to work with our cohort to see how they had formatted their regex.

The workflow was incredibly messy to due the time constraints, and I ended up converting the data to excel for two of the years that were causing trouble with the web scrape so I could start on the Dashboard.

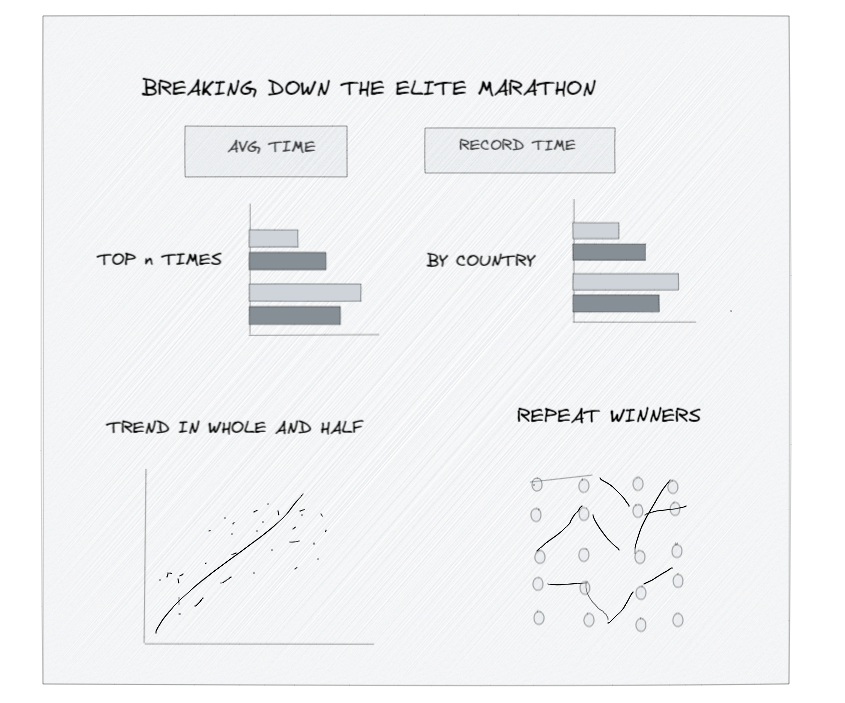
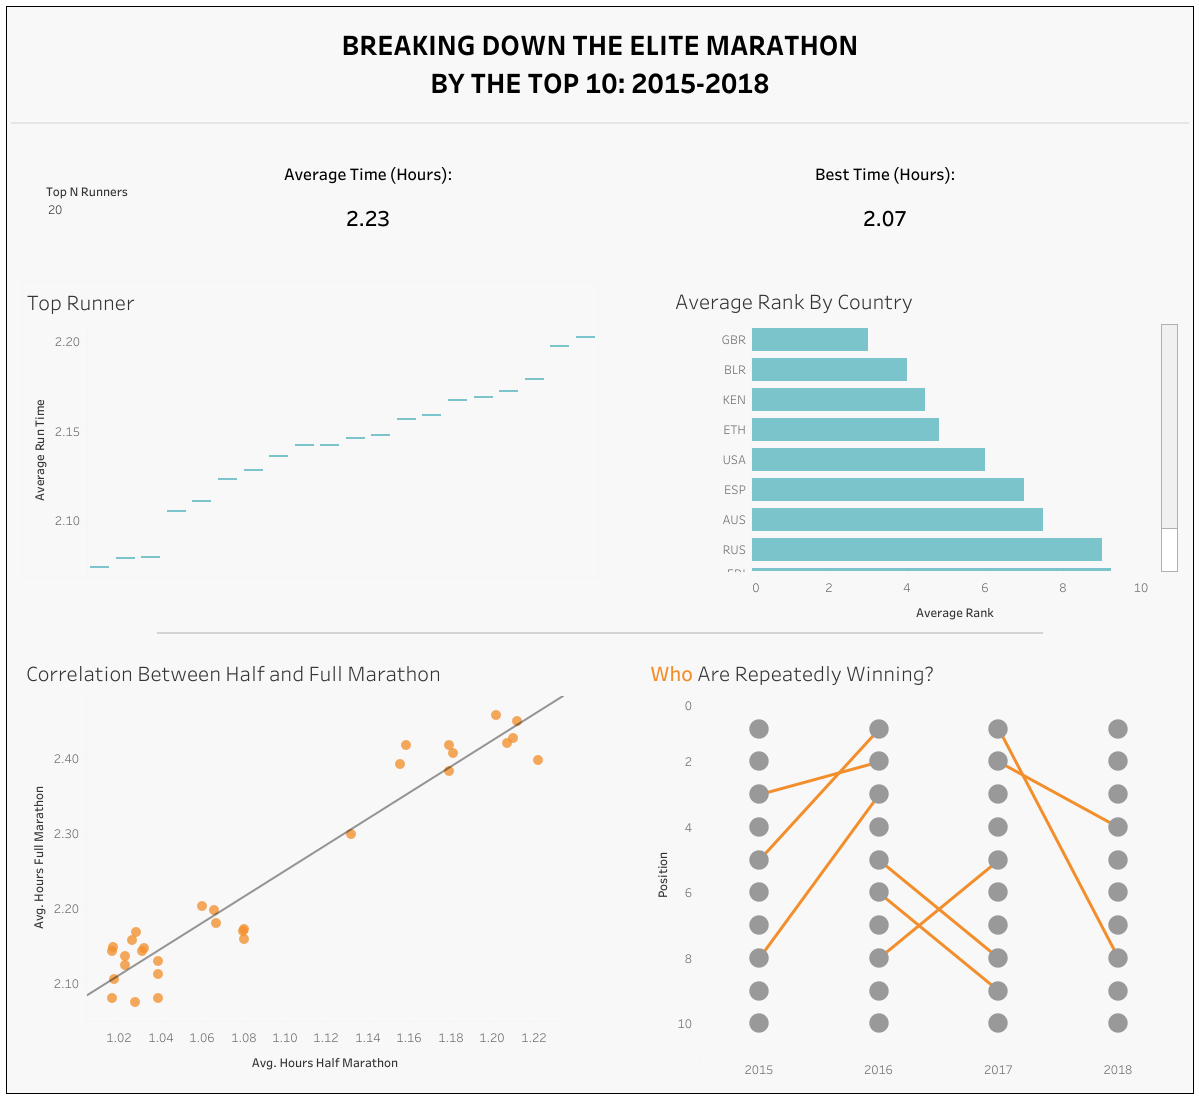
My plan was to get an much analysis as I could in the limited time, so I began to explore two areas I thought might prove interesting. These were the correlation between half and whole marathon runs, and how often someone wins multiple times. The correlation between the marathons proved to show an almost positive correlation as expected, and their weren't too many repeat winners over the four year period.
The analysis didn't prove as insightful as I had hoped, although I think it still shows some interesting points about the elite marathon.

The bad: The prep part took way too long to sort with the web scrapping due to issues with the data source. If I had to do this again I would have tried to limited the data quantity and focused on less years. The time constraints also proved to be an issue as I lost some of the morning to meetings.
The good: The work in Alteryx provided some great practise with web scrapping and getting data that is not readily downloadable. I think my dashboard also started to explore some interesting points that could have benefited with more years of data for future exploration.
Overall: This was a good experience in time management when working with difficult data, as well as web scrapping in Alteryx. Having to build a dashboard very quickly also helped to highlight how long formatting can take in Tableau and the time needed to plan ahead for this.
