


The Embedding API v3 is a modern JavaScript library that supports Tableau viz web components. You can embed Tableau views in web applications using the JavaScript library methods or via the Tableau viz web components and attributes in your HTML code without using the API directly.
This blog explores how to use the Tableau Embedding API with JavaScript to create a more interactive dashboard in your external application, website or portal.
Contents:
- Configuring and styling visualization
- Filtering viz
- Getting data from datasource
- Selecting marks from dashboard and retrieving mark data in frontend
Configuring and Styling Embedded Viz
You can easily confirgure and style your embedded visualization by specifying the property and value in th HTML tableau-viz component like below
<tableau-viz id="tableauViz"
             toolbar="hidden"
             hideTabs=true
             hideEditButton=true
             hideEditInDesktopButton=true
             suppressDefaultEditBehavior=true
             height="600px"
             width="1000px">
</tableau-viz>
... or via JavaScript.
// Step 1: Identify components from the HTML
const viz = document.getElementById("tableauViz");
const vizDiv = document.getElementsByClassName("viz-dashboard-div");

// Step 2: Call a function after web content finishes loading
document.addEventListener("DOMContentLoaded", function () {
  _initViz();
});

// Step 3: Function that defines the viz properties
function _initViz() {
  var vizWidth = vizDiv[0].clientWidth;
  var vizHeight = vizDiv[0].clientHeight;

  viz.src = vizURL;
  viz.toolbar = "hidden";
  viz.hideTabs = true;
  viz.hideEditButton = true;
  viz.hideEditInDesktopButton = true;
  viz.suppressDefaultEditBehavior = true;
  viz.height = vizHeight - 10;
  viz.width = vizWidth - 10;
}
Note that with the JavaScript method we make the viz's height and width more dynamic by making have similar dimensions to the div element that encapsules the Tableau visualization. The JavaScript method allows you to specify the properties dynamically based on specific conditions, while the HTML method is a static/fixed solution.
Filtering an Embedded Viz
Let's assume you want to filter an embedded view based on the checked option from a radio list like in the example below:
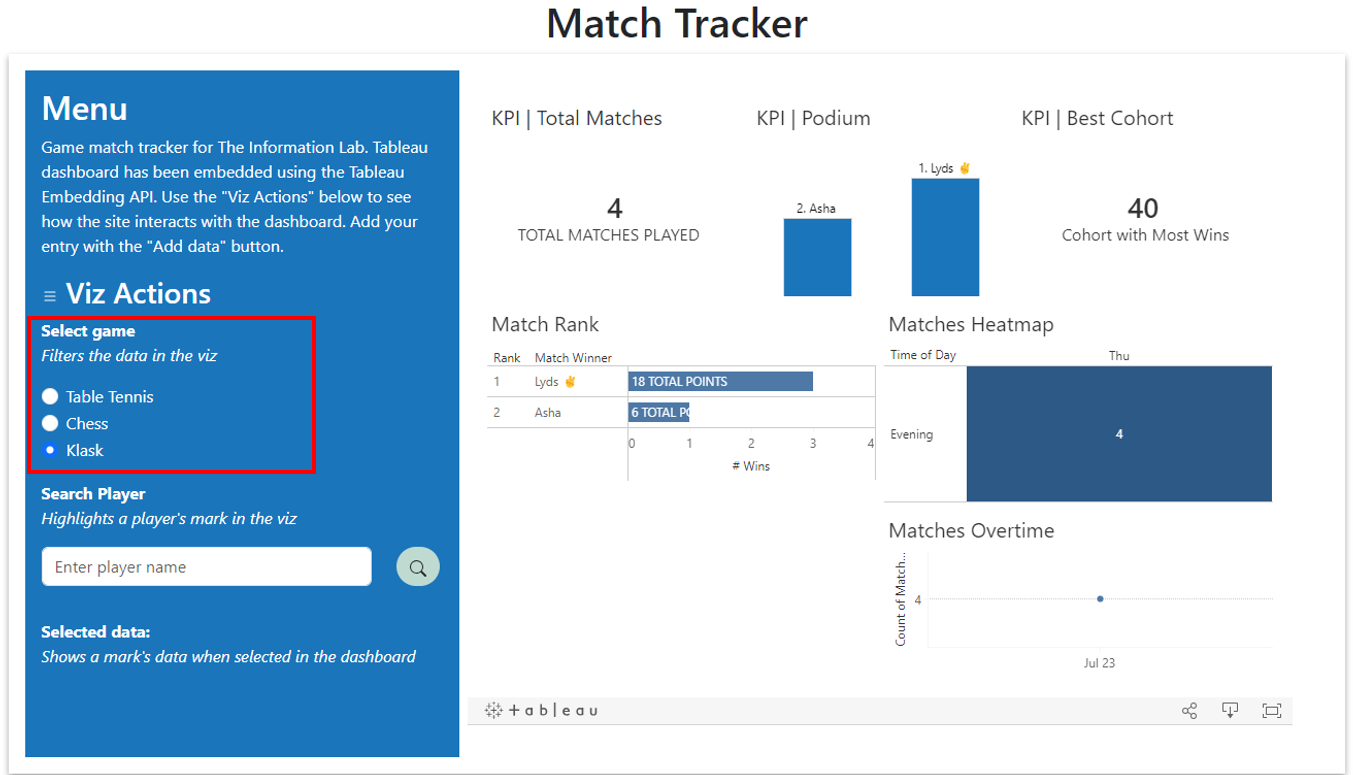
<!-- HTML code for the highlighted radio button list -->

<div class="menu-game-options">
  <p class="fw-bold mb-0">Select game</p>
  <p class="fst-italic">Filters the data in the viz</p>
    <div class="form-check">
    <input class="form-check-input" type="radio" name="flexRadioDefault" id="flexRadioDefault1" checked>
    <label class="form-check-label" for="flexRadioDefault1">
      Table Tennis
    </label>
  </div>
  <div class="form-check">
    <input class="form-check-input" type="radio" name="flexRadioDefault" id="flexRadioDefault2">
    <label class="form-check-label" for="flexRadioDefault2">
      Chess
    </label>
  </div>
  <div class="form-check">
    <input class="form-check-input" type="radio" name="flexRadioDefault" id="flexRadioDefault3">
    <label class="form-check-label" for="flexRadioDefault3">
      Klask
    </label>
  </div>
</div>Scenario: If a user selects a different game, the data in the dashboard should be filtered to show data for the selected game.
Procedure:
- Identify and define the radio input elements from the HTML in JavaScript.
- Initialise event listeners after loading the HTML elements.
- Listen to events (i.e. "change") emitted from these inputs. In the code below, listen to a "change" event from each radio button and call the
filterGame()function when the change occurs. TheradioBtnis the HTML element being passed as a parameter to the function (filterGame(radioBtn)). - Filter the embedded dashboard with the Tableau Embedding API. This function is asynchronous which are often used to perform tasks that take a long time to complete (in this case, an API call).
// Step 1: Identify components from the HTML
const gamesFilters = document.querySelectorAll('input[type="radio"]');

// Step 2: Call a function after web content finishes loading
document.addEventListener("DOMContentLoaded", function () {
  _initEventListeners();
  _initViz();
});

// Step 3: Function that defines the viz properties and a function that defines event listeners
function _initViz() {
  Same as above..
}
function _initEventListeners() {
  gamesFilters.forEach((radioBtn) => {
    radioBtn.addEventListener("change", () => {
      filterGame(radioBtn);
    });
  });
}

// Step 4: Function that filters the dashboard based on the selected "Game"
async function filterGame(radioBtn) {
  if (radioBtn.checked) {
    const label = radioBtn.nextElementSibling.textContent.trim();
    console.log("Selected game:", label);
    var sheet = viz.workbook.activeSheet;
    await sheet.applyFilterAsync("Game", [label], FilterUpdateType.Replace);
  }
}
See the official documentation:

Getting Data from Datasource of an Embedded Viz
The Embedding API v3 provides methods that you can use to access the data in an embedded view. The data you can access includes the summary or aggregated data, and also the underlying data (or full data). We can obtain data from a worksheet, a datasource or a selected mark.
<!-- HTML code for table -->
<section class="viz-table-section py-5">
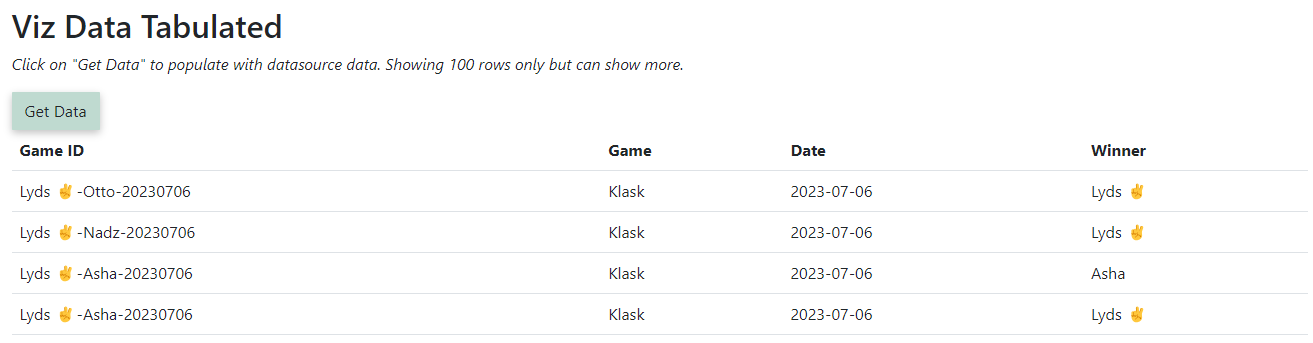
<h2>Viz Data Tabulated</h2>
<p class="fst-italic">Click on "Get Data" to populate with datasource data. Showing 100 rows only but can show more.</p>
<button type="button" class="get-data-btn btn btn-custom-secondary">Get Data</button>
<div clas="table-responsive">
<table class="table viz-table">
<thead class="table-headers">
<tr>
<th scope="col">Game ID</th>
<th scope="col">Game</th>
<th scope="col">Date</th>
<th scope="col">Winner</th>
</tr>
</thead>
<tbody class="table-body">
</tbody>
</table>
</div>
</section>Scenario: A user can get data from the datasource to view in a tabular form in the html.
Procedure:
- Specify the name of the datasource and identify and define the button element from the HTML in JavaScript.
- Initialise event listeners after loading the HTML elements.
- Listen to events (i.e. "change") emitted from these inputs. In the code below, listen to a "click" event from the "Get Data" button and call the
getDatasourceData()function when the change occurs. - Get data from the viz's datasource with the Tableau Embedding API. This function is asynchronous which are often used to perform tasks that take a long time to complete (in this case, an API call).
- Display it in a tabulated form in the HTML (explanation below)
// Step 1: Identify components from the HTML and specify the name of the datasource
const datasourceName = "Tableau Embedding - TT Match Tracker Mock";
const getDataBtn = document.getElementsByClassName("get-data-btn")[0];
// Step 2: Call a function after web content finishes loading
document.addEventListener("DOMContentLoaded", function () {
_initEventListeners();
_initViz();
});
// Step 3: Function that defines the viz properties and a function that defines event listeners
function _initViz() {
Same as above..
}
function _initEventListeners() {
..Same as above
getDataBtn.addEventListener("click", getDatasourceData);
}
// Step 4: Function that gets data from the viz's datasource and displayes it in a tabulated form
async function getDatasourceData() {
var worksheet = viz.workbook.activeSheet.worksheets[0];
const dataSources = await worksheet.getDataSourcesAsync();
const dataSource = dataSources.find(
(datasource) => datasource.name === datasourceName
);
const logicalTables = await dataSource.getLogicalTablesAsync();
const dataTable = await dataSource.getLogicalTableDataAsync(
logicalTables[0].id
);
console.log("Data source logical table data: ", dataTable);
populateVizTable(dataTable.data);
}
// Step 5: Display data in a populated form in the HTML
function populateVizTable(data) {
var table = document.getElementsByClassName("table viz-table")[0];
var tbody = table.getElementsByTagName("tbody")[0];
for (var i = 0; i < 100; i++) {
var row = document.createElement("tr");
var record = {
// Creates a "record" from the datasource data
// Hardcoded for test purposes (e.g. [3] points to match id). Can be edited
gameId: data[i][3].value,
game: data[i][1].value,
date: data[i][0].value,
winner: data[i][5].value,
};
Object.keys(record).forEach((key) => {
var cell = document.createElement("td");
cell.textContent = record[key];
row.appendChild(cell);
});
tbody.appendChild(row);
}
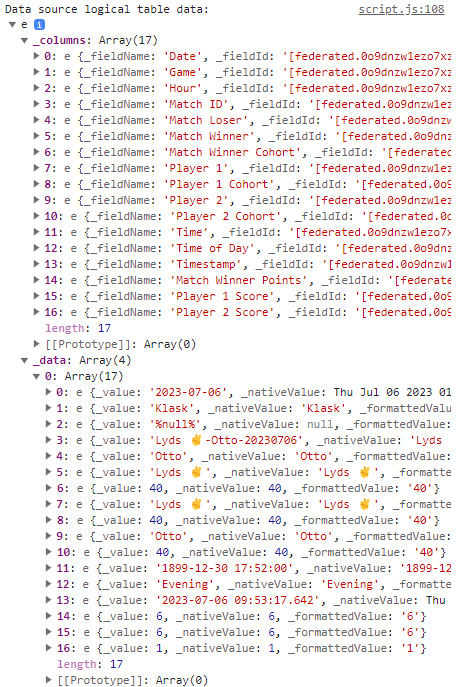
}The getDatasourceData() function retrieves data from the viz's datasource. This is then send to the populateVizTable(data) function to display it in the HTML. The populateVizTable(data) function extract the desired "data" and creates a single row that is then appended to the table in the HTML. This is then repeated for the next row of data.
The data retrieved from the getDatasourceData() function is formatted as shown below:
See official documentation:
Selecting Marks from Frontend Elements
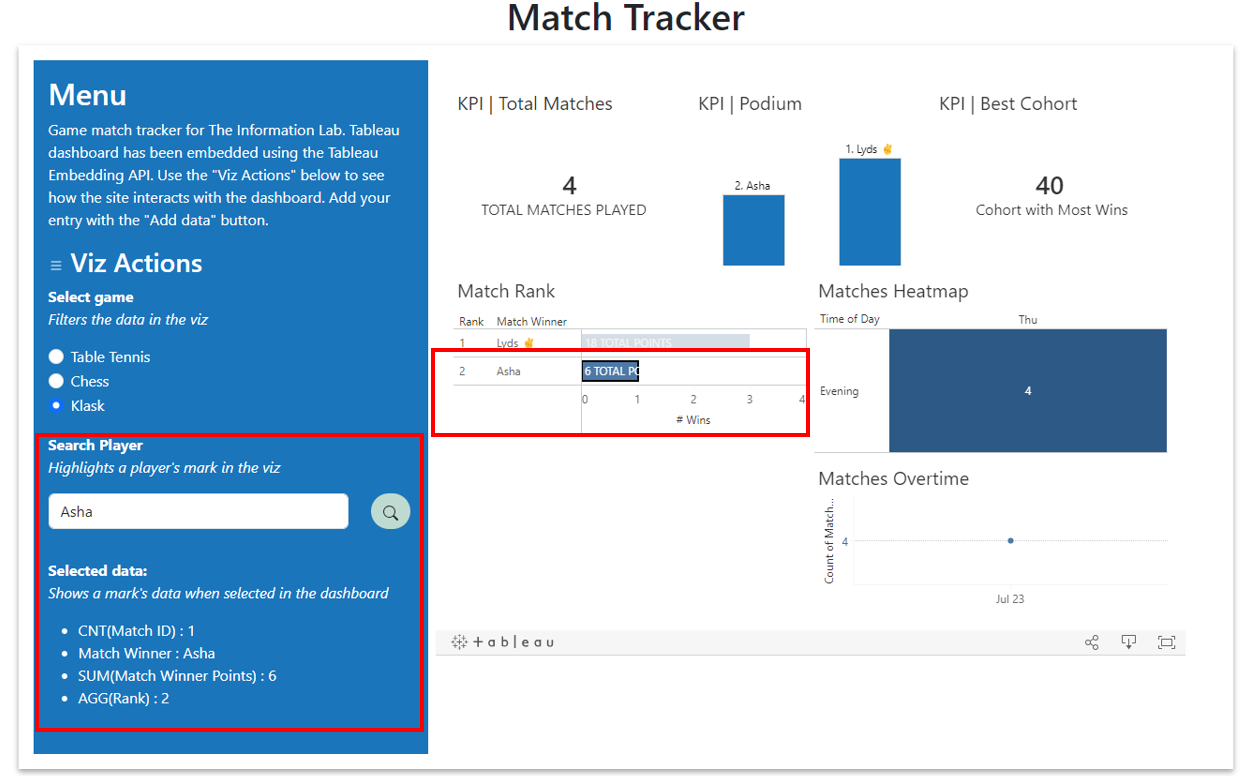
Let's assume you want to highlight a mark in the view and retrieve data from the highlighted mark (or any selected mark) in the front-end of the website or external platform like shown below:
<!-- HTML code for search input and selected data list -->

<div class="winner-form-floating py-3">
    <label class="fw-bold" for="winnerInput">Search Player</label>
    <p class="fst-italic">Highlights a player's mark in the viz</p>
    <div class="row">
      <div class="col-10">
        <input class="winner-input form-control" id="winnerInput" placeholder="Enter player name">
      </div>
      <div class="col-2">
        <button type="button" class="search-winner-btn btn btn-custom-round">
        <svg xmlns="http://www.w3.org/2000/svg" width="16" height="16" fill="currentColor" class="bi bi-search" viewBox="0 0 16 16">
          <path d="M11.742 10.344a6.5 6.5 0 1 0-1.397 1.398h-.001c.03.04.062.078.098.115l3.85 3.85a1 1 0 0 0 1.415-1.414l-3.85-3.85a1.007 1.007 0 0 0-.115-.1zM12 6.5a5.5 5.5 0 1 1-11 0 5.5 5.5 0 0 1 11 0z"/>
        </svg>
      </button>
    </div>
    </div>
</div>
<div class="show-data-selected py-3">
    <p class="fw-bold mb-0">Selected data: </p>
    <p class="fst-italic">Shows a mark's data when selected in the dashboard</p>
    <ul class="show-data-list"></ul>
</div>
Scenario: If a user searchs for a player from the front-end of the website or platform, the player is highlighted in the dashboard and its data is retrieved and displayed in the front-end.
Procedure:
- Identify and define the button element from the HTML in JavaScript.
- Initialise event listeners after loading the HTML elements.
- Listen to events emitted from these inputs. In the code below, listen to a "click" event from the "Search" button and call the
searchPlayer()function when the change occurs. Also, listen to the Tableau EmbeddingTableauEventType.MarkSelectionChangedevent when a mark is selected from the dashboard, and call thehandleMarkSelection()when the event occurs. - Highlight a mark in the dashboard via the
searchPlayer()function with the Tableau Embedding API. - Get data from highlighted mark in the dashboard via the
handleMarkSelection()function with the Tableau Embedding API. Then display it in the HTML (explanation below).
// Step 1: Identify components from the HTML
const searchWinnerBtn = document.getElementsByClassName("search-winner-btn")[0];
const viz = document.getElementById("tableauViz");

// Step 2: Call a function after web content finishes loading
document.addEventListener("DOMContentLoaded", function () {
  _initEventListeners();
  _initViz();
});

// Step 3: Function that defines the viz properties and a function that defines event listeners
function _initViz() {
  Same as above..
}
function _initEventListeners() {
  viz.addEventListener(
    TableauEventType.MarkSelectionChanged,
    handleMarkSelection
  );
  searchWinnerBtn.addEventListener("click", searchPlayer);
}

// Step 4: Function that highlights a mark in the dashboard
async function searchPlayer() {
  // Identify the input element and gather its value
  // Specify the dashboard sheet and the fieldName to highlight the mark from
  const inputElement = document.getElementById("winnerInput");
  const sheet = viz.workbook.activeSheet.worksheets[3];
  const selection = [
    {
      fieldName: "Match Winner",
      value: inputElement.value.trim(),
    },
  ];
  console.log("Selecting...", inputElement.value, sheet);
  await sheet.selectMarksByValueAsync(selection, SelectionUpdateType.Replace);
}


// Step 5: Function that gets data from selected mark and displays it in HTML
async function handleMarkSelection(event) {
  const marksCollection = await event.detail.getMarksAsync();
  const marksData = marksCollection.data[0];
  const listEl = document.getElementsByClassName("show-data-list")[0];
  listEl.innerHTML = "";
  var dataSelected = createRecords(marksData);
  for (var i = 0; i < dataSelected.length; i++) {
    var record = dataSelected[i];
    var listItem = document.createElement("li");
    Object.keys(record).forEach((key) => {
      listItem.textContent = key + " : " + record[key];
    });
    listEl.appendChild(listItem);
  }
}

function createRecords(marksData) {
  var columns = marksData.columns;
  var data = marksData.data[0];
  var output = [];
  for (var i = 0; i < columns.length; i++) {
    var record = {};
    record[columns[i].fieldName] = data[i].value;
    output.push(record);
  }
  console.log("Selected mark data: ", output);
  return output;
}
The handleMarkSelection() function first retrieves the data (field names and values) from the selected mark in the same format as shown in the previous section. The createdRecords() functions receives the data retrieved from the mark and combines them so that the "column" and "data" values are in a single record. It then assigns the output to the dataSelected variable which is processed in the handleMarkSelection() function to append it in a list element in the HTML.
See official documentation:
Resources