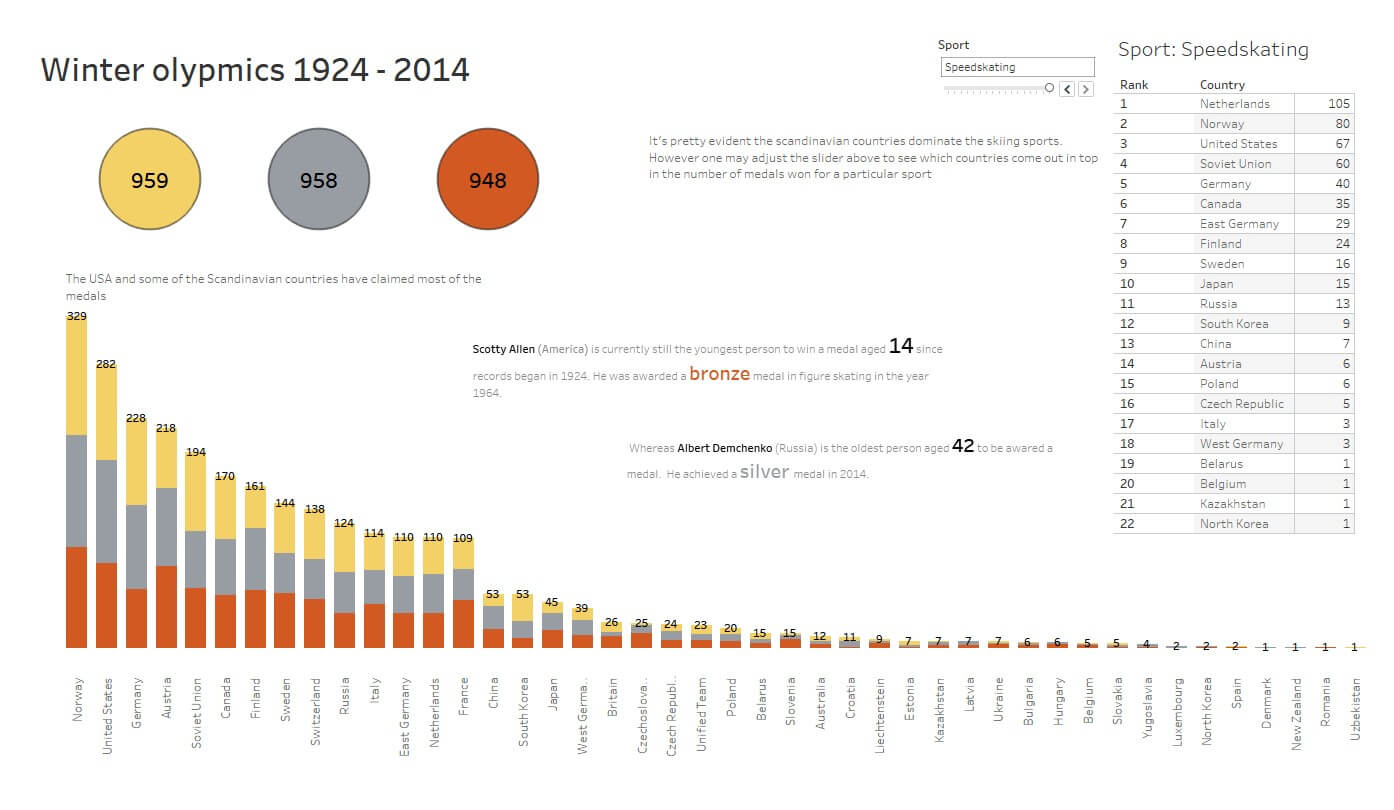
So if you’ve probably used Tableau before, you would’ve most likely come across a weekly social data project by the name of #MakeoverMonday. If not (you’ll soon find out why so many people take part in it!) check it out here. The rules for this project as outlined in the link are simple, use the data associated with the viz to improve on the visualisation. But the real test comes from producing a visualisation quickly, say in an hour.
In my case I have had around 2 months of Tableau experience and I’m familiar with #MakeoverMonday but have yet to take part in it, until now. This weeks data was on the Winter Olympics. At first I went headfirst without a plan, and therefore struggled in balancing all the things I wanted to do inside the hour. In the end I spent more than an hour on it, you can see it above or you can check it out here. I felt I needed a basic approach in creating a good viz, so this blog is about what I feel the steps, I, or anyone new to #MakeoverMonday should take in the future to help create a viz within the hour.
Step 1
Spend around 20 minutes looking through the data and look for anything interesting or a question about the data you wish to answer. Playing around with the data by creating different chart types can also help inspire ideas. Or simply just glance over the other #MakeOverMonday submissions if you’re lacking inspiration, who knows what you might find! Literally jot down your thoughts, because in the mayhem of trying to find something interesting quickly, you’ll probably forget it (it happens, to me especially!)!
Step 2
So now you most have decided on one or two things you’d like to create visualisations for. Different chart types reveal hidden insights about the data and if you’ve played around with different chart types in step 1 you would probably be happy about using it in the final viz. So if you haven’t, spend around 20 minutes finding an appropriate combination of charts. For my viz, I wanted to show the distribution of medals awarded to countries across the world. It was interesting to see only a few countries held the majority of medals, which was pretty evident from a simple bar chart. You can see for yourself which countries received the most on my viz. I feel under a time constraint, it’s wise to keep the charts simple. I feel the complexity of the charts will naturally increase with practice and experience. So here’s hoping.
Step 3
Now comes the final part of building the viz, the formatting. This is a case of easier said than done. Spend the remainder of the hour just making sure the viz looks good. Sometimes I struggle on designing vizzes, but I usually draw inspiration from Tableau Public gallery or any other #MakeoverMonday vizzes.
As this is an initial plan and a learning process, the time taken for each part will vary as I develop my tableau and viz skills. I would be happy if anyone could contact me on twitter or LinkedIn with their thoughts, suggestions and tips on how they approach their #MakeOverMonday visualisations. And for anyone else in the same boots as me, let me know if this blog helped!
