On the second day of DS14’s dashboard week, we were tasked with visualising data about battlefield sites in the UK. This involved a lot of regexing and not much visualising. Here is how my day went:
Getting the data
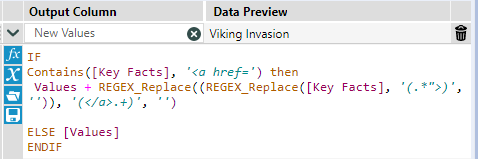
Our task for the day was to download data about UK battle sites from Historic UK‘s website – we needed to retrieve key facts about a number of major battles around the UK. This meant that I spent most of today (6 hours) regexing in Alteryx. Similarly to yesterday, first I retrieved a list of the battles and a list of links to get more information about each battle. This was relatively easy but when I attempted to clean the information about each battle is when the fun started. I ended up using a LOT of regex. My proudest moment of the day was when my regex in a regex function actually worked and gave me the information I wanted (see pic below).
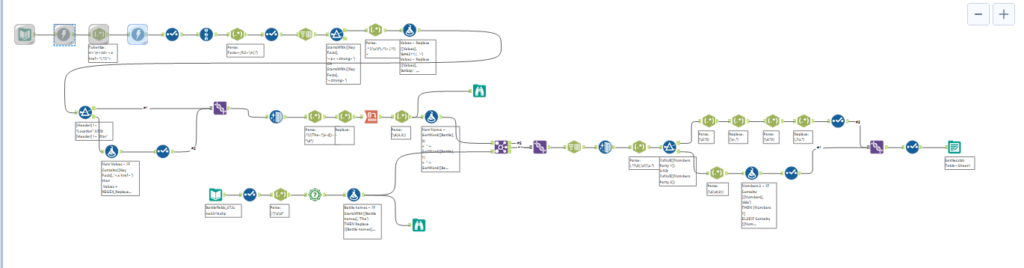
I also decided to use a shapefile to later visualise the battle sites – I managed to join this file to my original dataset after a lot of struggle, at which point Andy decided that today’s task was not challenging enough and changed the requirements: we were only allowed to use the 10.0.22 or older version of Tableau. Funny enough, shapefiles cannot be used with this version of Tableau…
Eventually, I stopped working in Alteryx at 3pm by which time my workflow looked far too complicated for what I needed it to do. However, I cannot say that I did not enjoy cleaning the data, I was just simply concerned about the time – we also had to create a visualisation and a blog post by 5pm.
Creating the dashboard
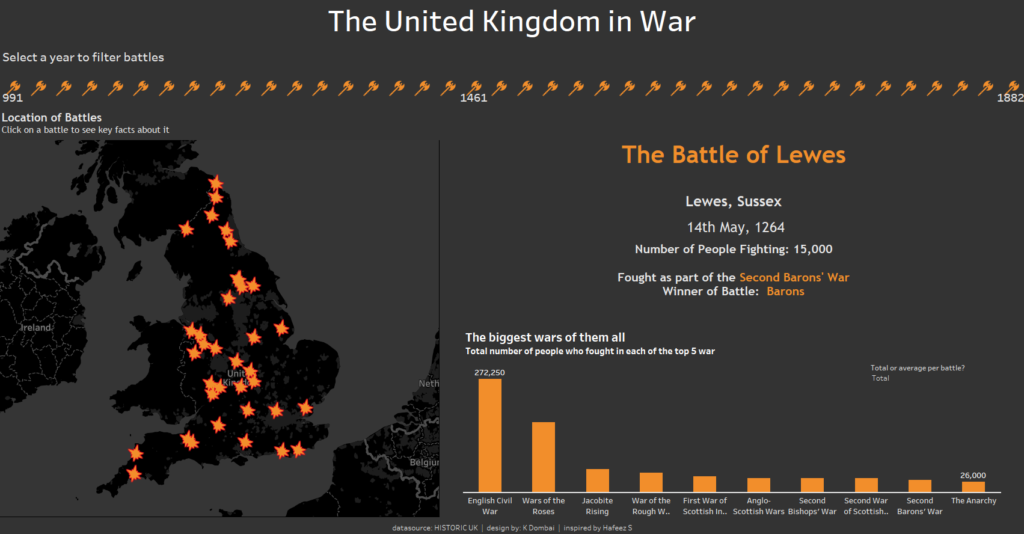
I found the visualisation part of today’s task a lot more challenging than downloading and cleaning the data. There was a lot of text in the data and I did not leave enough time to create a presentable dashboard. After playing around with different chart types for a while, I decided to place the battles on a map, display the key facts about them, and create a simple bar chart which shows the number of people who fought in each war.
Looking forward to day 3?