For today’s dashboard week, we were asked to analyse the results and turnouts for the EU referendum of 2016. This dataset was set up as a CSV file containing the results broken down by Local Authorities including electorate size, turnout, votes for Leave and Remain, and the percentages. Other fields were included in the dataset, but for my purposes these were all I needed.
Pulling in the results dataset to Tableau, I explored whether geographic data could be used by converting the Area Code field to a County. This allowed around 40% of Counties to match but lost a significant chunk of the dataset (around 240 counties mostly in the E06 and E07 regions). I found that the area codes were GSS codes (or Government Statistical Service) referring to various Local Authority Codes.
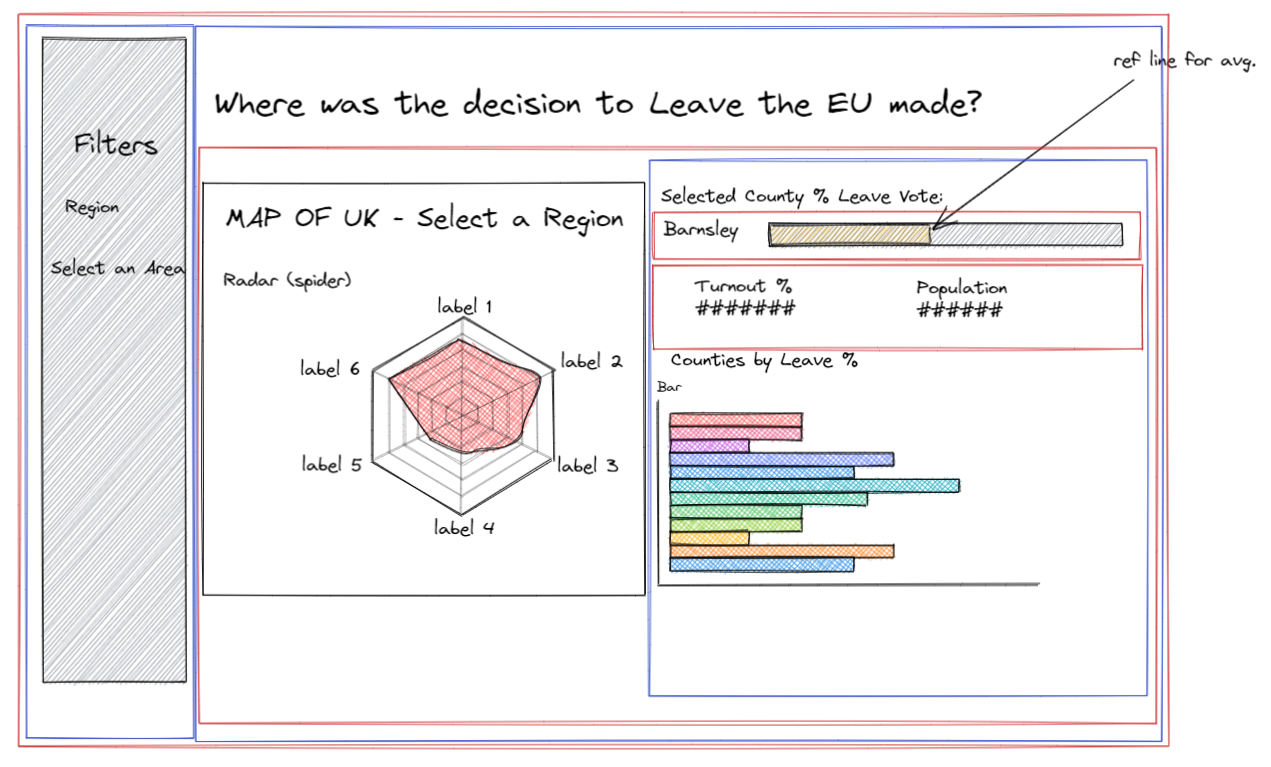
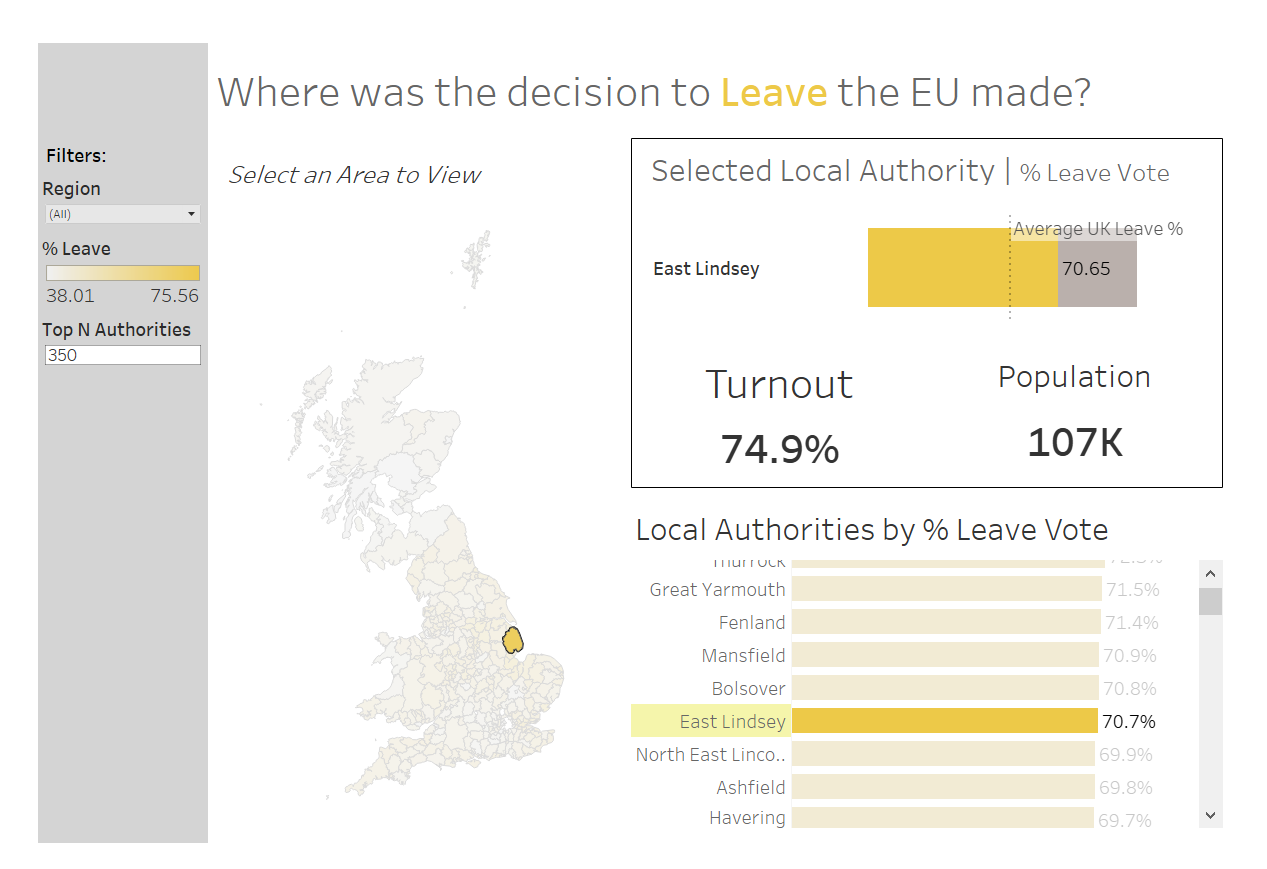
I wanted to be able to select a region from the left-hand side to bring up a profile for the region that could be compared against the UK averages.

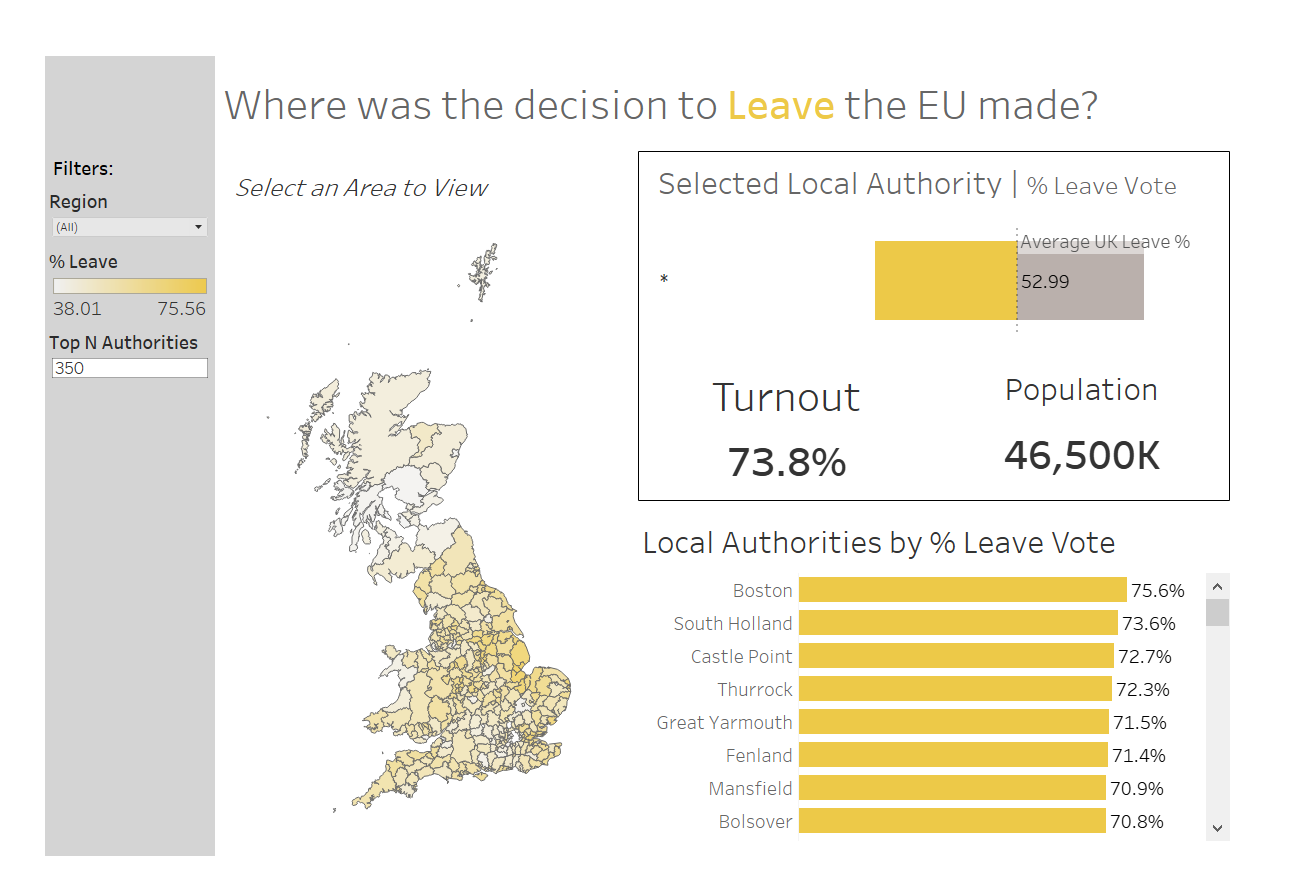
After building the Viz, I continued my attempts to get the spatial mapping to work. Using the files found here, I was able to map the Area Codes to give a more comprehensive view, leading to the viz below:


The dashboard came out more or less as I envisioned. I was unable to set up the manual Local Authority selection button on the left-hand side as I had wanted. I think the charts could also have been improved with more context added, particularly with the map. The title was removed as it was a repetition of titles elsewhere in the viz, but we lose some of the context by doing so. I would also have liked to implement interactivity allowing the user to sort the Local Authorities bar chart by ascending or descending dynamically, as well as adding in a Ranking for the Local Authorities by Leave %. These would have helped in providing more useful context to the Local Authorities profile. Finally, I would have liked to improve the formatting, cleaning up the view and formatting text to be more consistent.
If you would like to test the interactivity, this dashboard can be found on my Tableau Public profile here.
