Hans Rosling (1948 - 2017) was the Swedish physician and professor behind the famous "Joy of Stats" in 2010 and founder of Gapminder Foundation. He made this amazing visualization of international statistics into interactive graphics, plotting life expectancy against income in every nation for 200 years. . And I am just amazed how he delivered a powerful 'world history' in 4 minutes.
I have not heard of his name not until I started to learn Data Science last year (what a shame). The Gapminder dataset was the first dataset I have to work with, using python, matplotlib and imageio. Incidentally, I stumbled into the same dataset in a Workout Wednesday Challenge 2021 week 11 by Coach Lorna Brown.
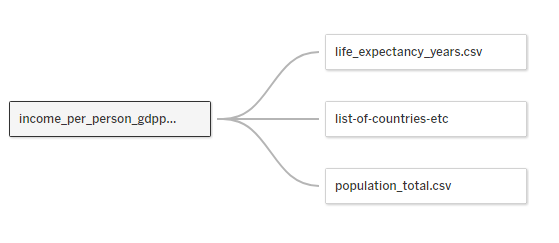
Recreating Rosling's work in Tableau was not so hard. It involves pivoting the years, then relating datasets to bring them all together and build a Scatterplot.

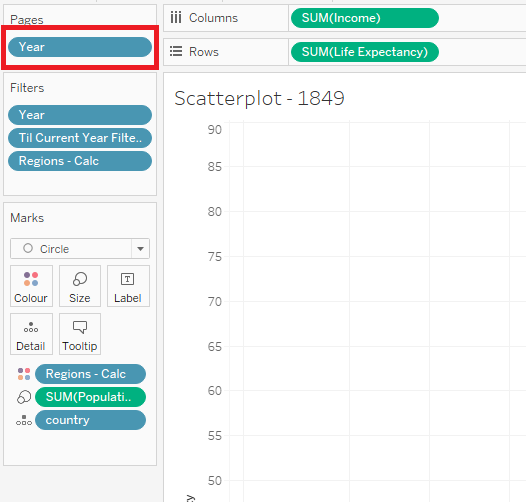
The important step is bring the YEARS into the Pages card to have the animation function.

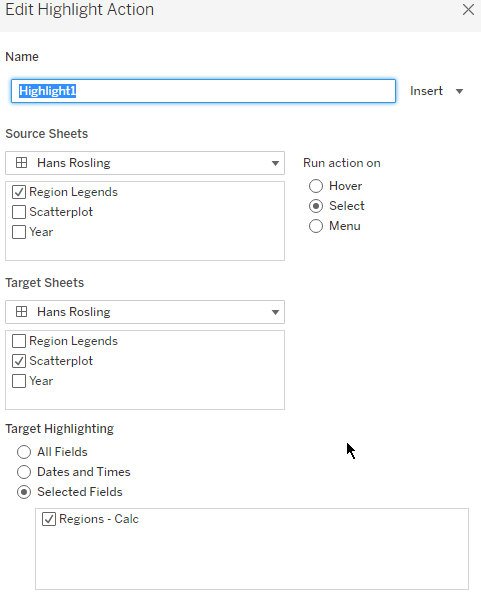
And another important step in the dashboard is to bring the year BAN (Big 'Animated' Number) behind the Scatterplot and format highlighting actions to the Region BAN.

Here's my take on this challenge: MyTableauPublic. Lorna also detailed the steps in the solution video. I really find this challenge cool.
