Dashboard Week has come to an end and all of DS9 survived! It’s been the best week at the DS so far!! Going through presentations, data prep, creating a dashboard, and blogging every day was a fun challenge because I learnt a lot and felt accomplished at the end of the day. I had heard from other people that they slept very little during dashboard week, but we seemed to be lucky with the challenges Andy gave us. We usually finished our data prep around lunchtime and had the entire afternoon for creating a viz in Tableau and writing a blog post.
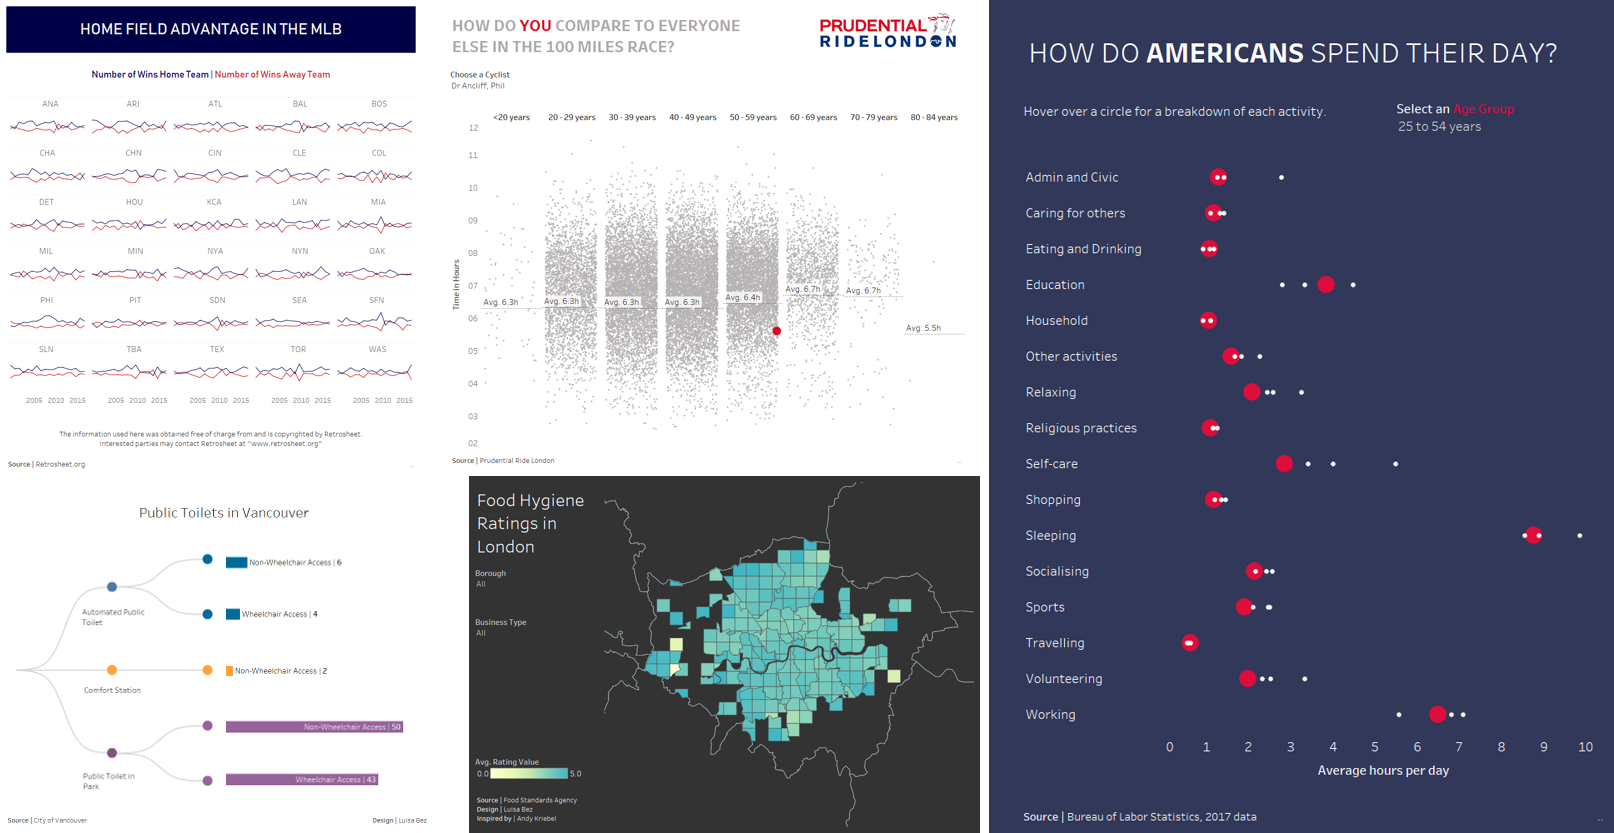
All of my dashboard week vizzes
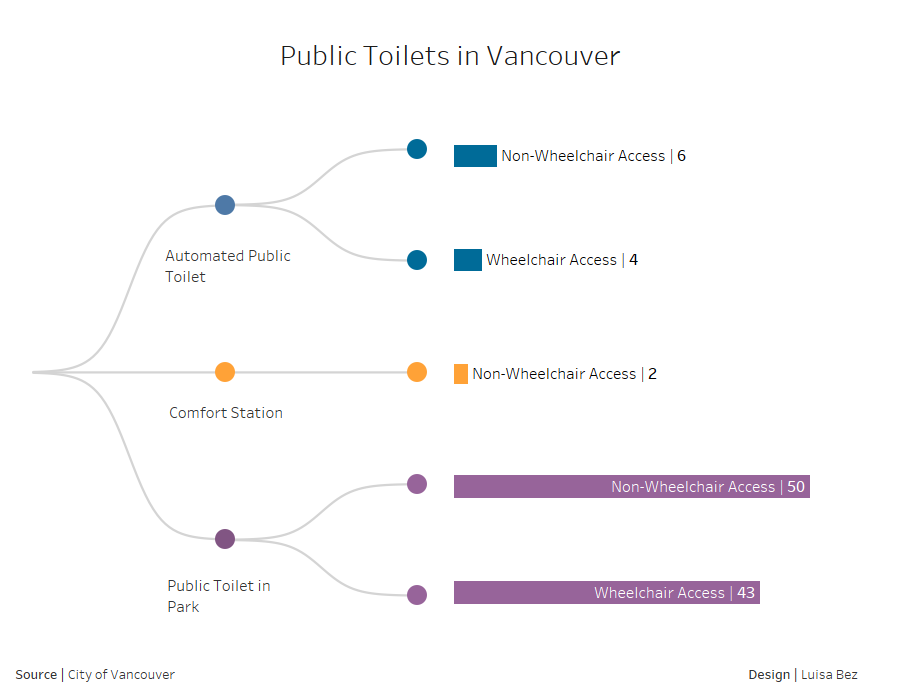
That being said, today was the most stressful day. We didn’t have to prepare any data in Alteryx, but were given a simple dataset about public toilets in Vancouver instead. The data didn’t leave much room for creativity and we only had two hours to come up with something meaningful before we presented it to DSX and clients. Rather than going for a map displaying the exact locations of each toilet I decided to create a tree map inspired by Klaus Schulte and investigated which public toilets are wheelchair accessible.