One of the common charts for visualisation are Top N charts, for exmaple, top 10 Products by sales or profit. Top N filters can be created by putting the dimension on the filter card and using the 'TOP' pane in the filter configuration pop up. However once this number is given it remains fixed and does not allow a dashboard user to easily change this N value interactively.
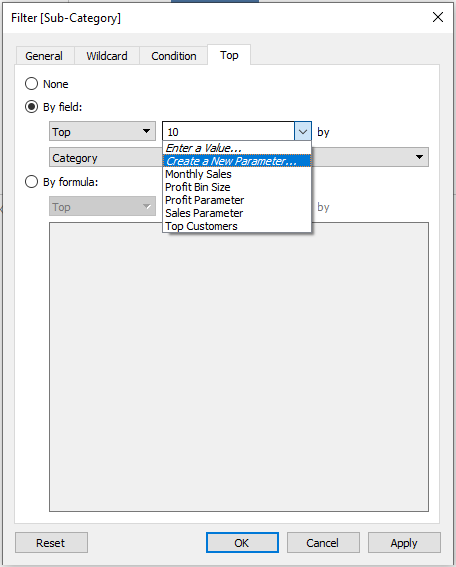
To make it more dynamic, we could simply use a parameter. In the 'Top' pane of the filter configuration window, click on the drop down where you will normally enter the N value and select 'Create a new parameter'.
Configure the parameter as it suits your viz. Now show the parameter and voila!!! You or a user can easily change this number without having to go back to the sheet to edit the filter. WATCH OUT!!! Depending on your visualization remember to check if you need to put certain filters into context or not.