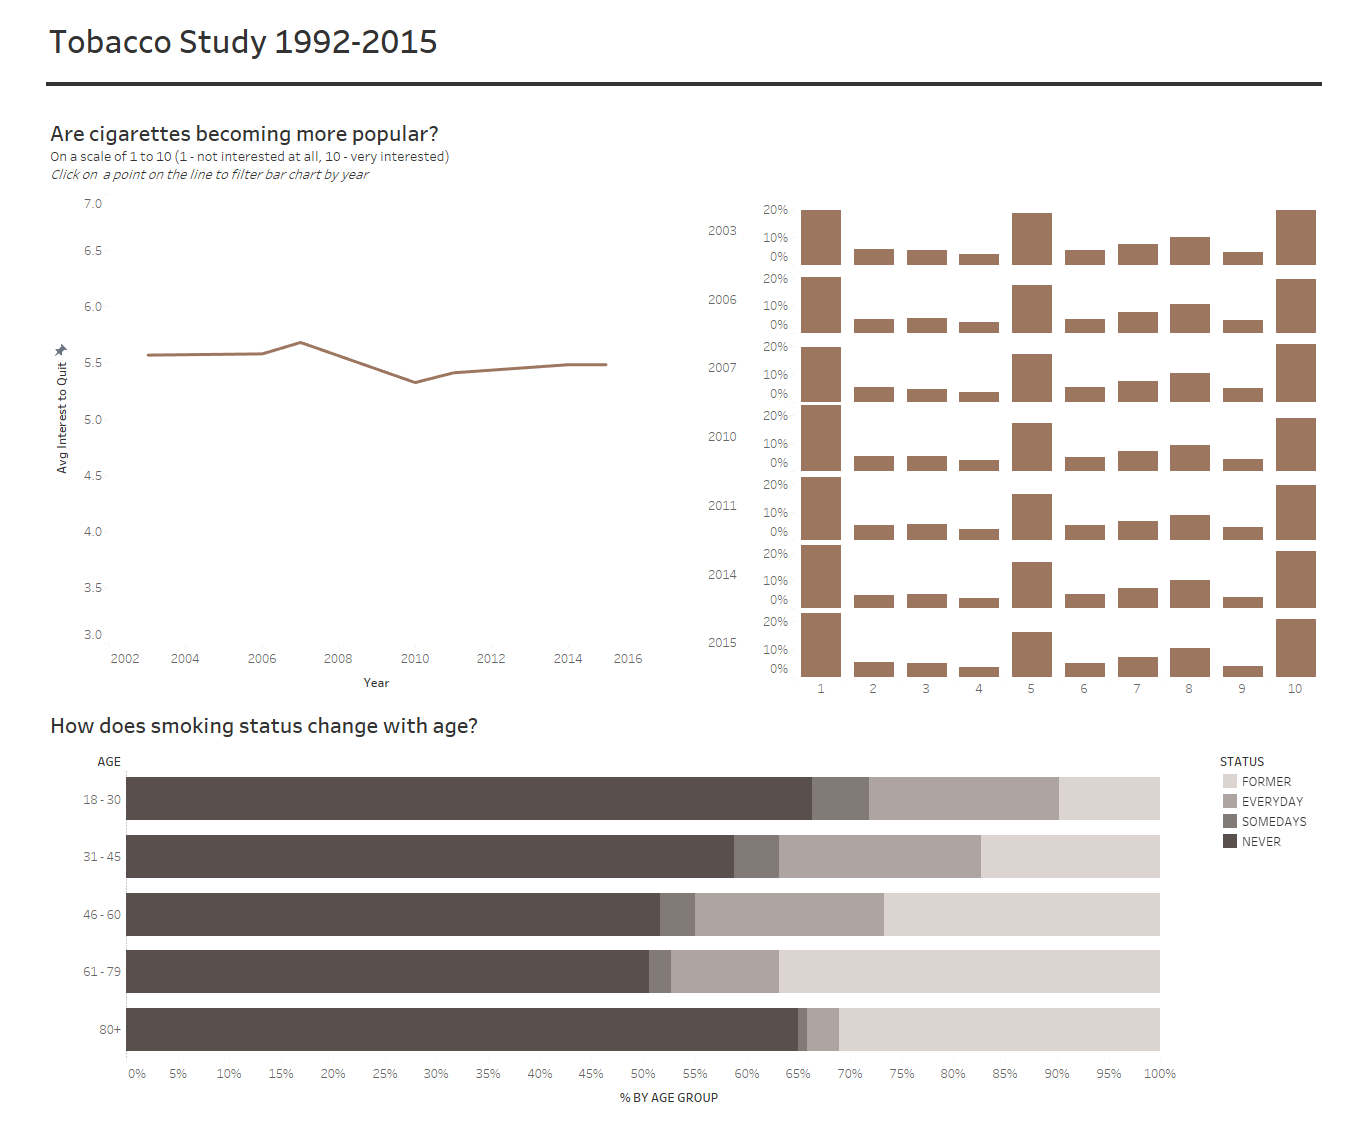
Day 2 of dashboard week - today's subject was tobacco usage had a greater focus on analysis and what insights we can get from the data as opposed to dashboard design. We were given this dataset to work with.
First issue: opening and using the data. The data was initially in a DAT file format which I didn't think was able to be opened in Alteryx so I spent the first chunk of time scouring the web for DAT to csv converters and tutorials.
However, the size of the file was too hefty for most converters to deal with and I eventually found out that you can read the file into Alteryx as it was, but calling it an unfriendly format would be an understatement.
It required parsing out the each row into individual characters and concatenating the survey answers that would be useful in my investigation whilst dropping out unnecessary data. With the help of some regex tools, a data dictionary and a ton of manual formulae typing I got to work on parsing the data out.
After a serious finger workout, I saved the final table into a hyperfile and input the data in Tableau to begin investigation.


I started off by brainstorming some questions and figuring out whether I had the correct data to actually answer them. I created some of the graphs that I initially planned to do and did the best with what I had.

The main challenge today was without a doubt the time it took to fix up the data which gave me minimal time to actually investigate the data itself. A positive would be that I managed to complete my blog and publish my dashboard on time.
