Final day of dashboard week, today's theme was the Brexit results. Today in particular was a little more time pressured as we had until 11.30am as opposed to 3pm on the previous days. We also had more emphasis placed on dashboard design.
Unlike other days, the dataset was quite simple to read into tableau so I could spend the majority of my time on planning my dashboard and what data I actually wanted to use.
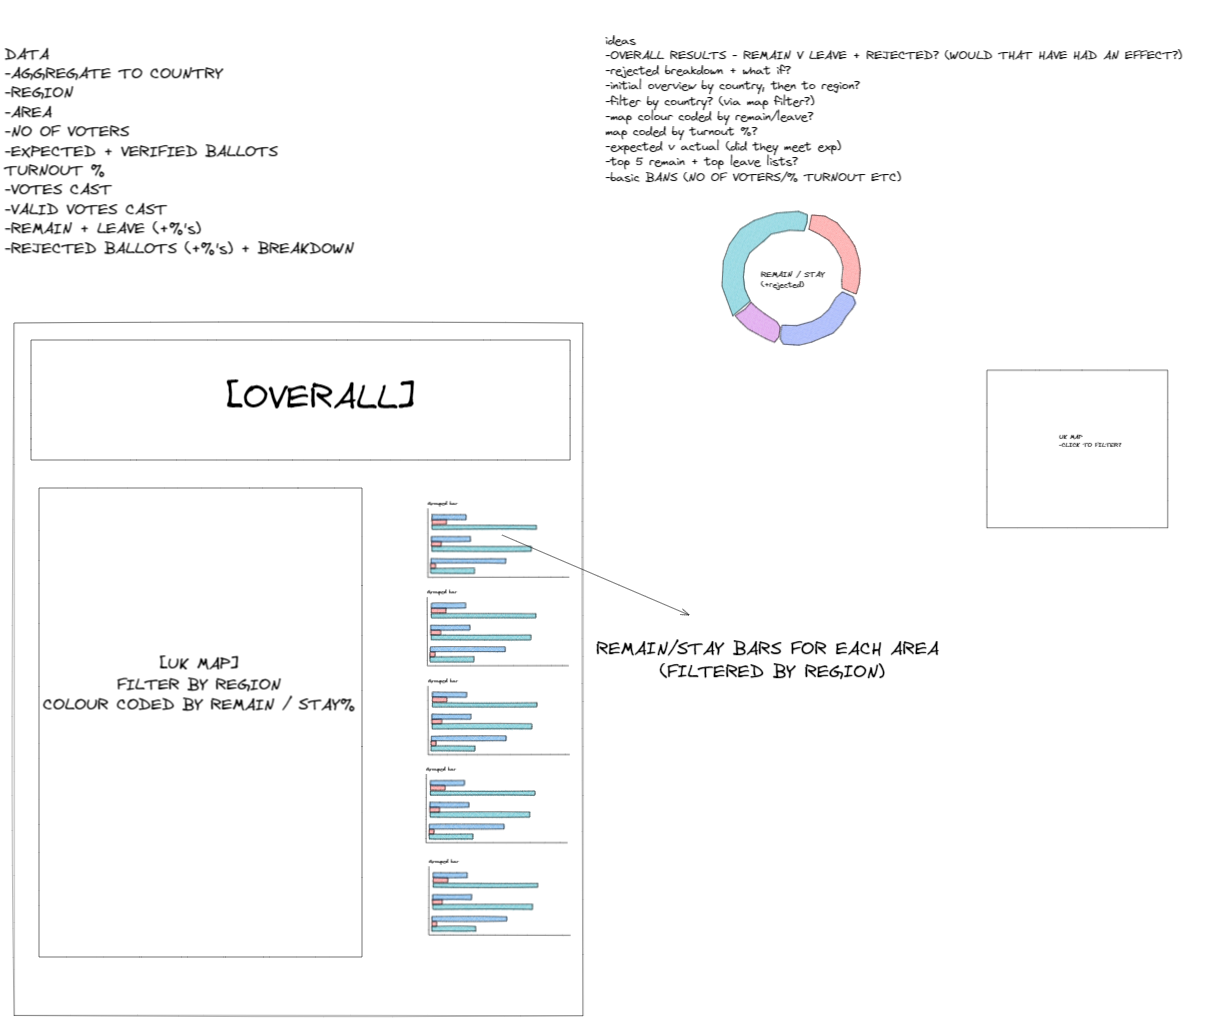
I made an initial plan on Excalidraw and just generally brainstormed my initial thoughts.
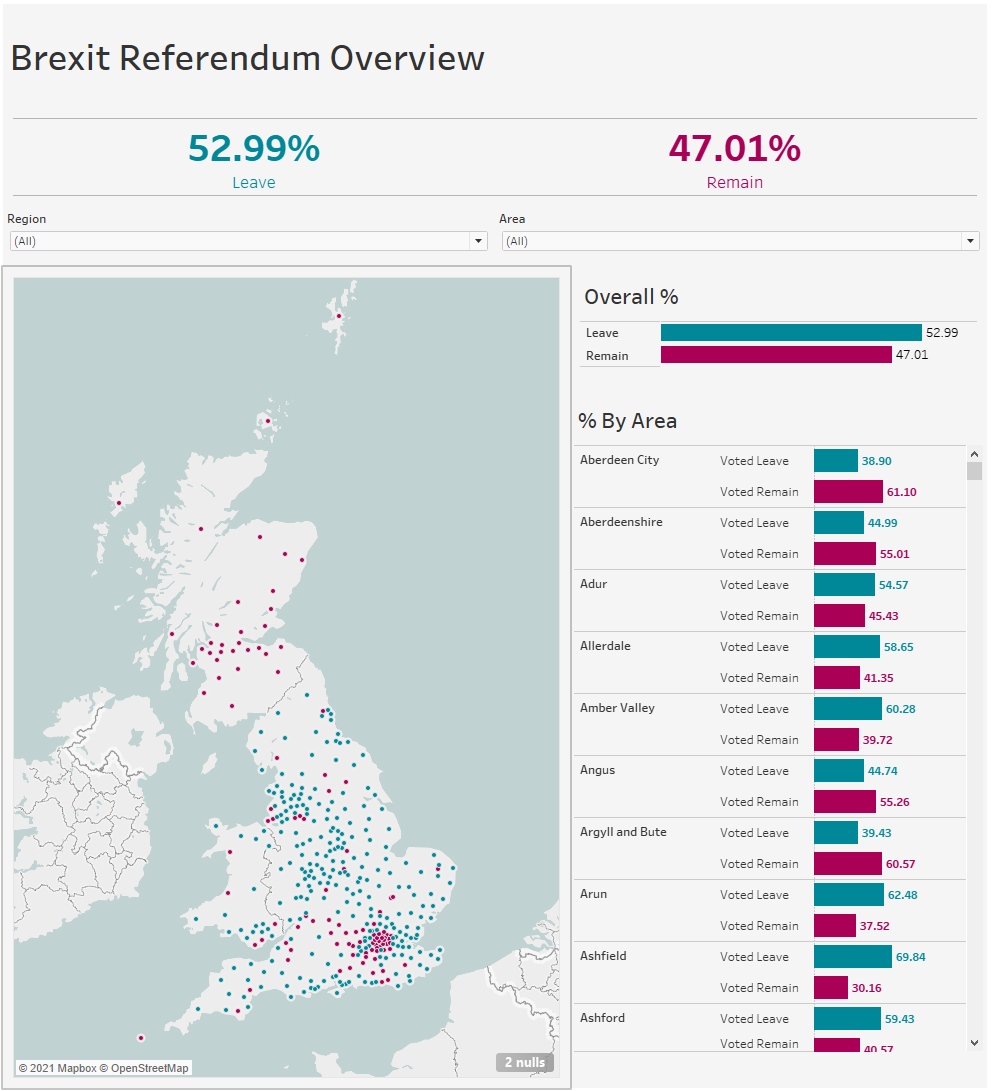
My greatest issue came from looking for a shapefile which was able to join with the area field in the dataset. London shapefiles tended to be much easier to find but I was hellbent on finding a UK map. In hindsight, it may have been better to have settled for a London map but I did end up finding a UK map to create a map from.
After fiddling around with tableau joins and relationships, I was finally able to form my map and build the other graphs for my final dashboard.