When you are going out in London, the Food Standards Agency makes sure you do not get food poising. It visits business which handle food and gives them a rating from 0 to 5 with 5 being the highest value.
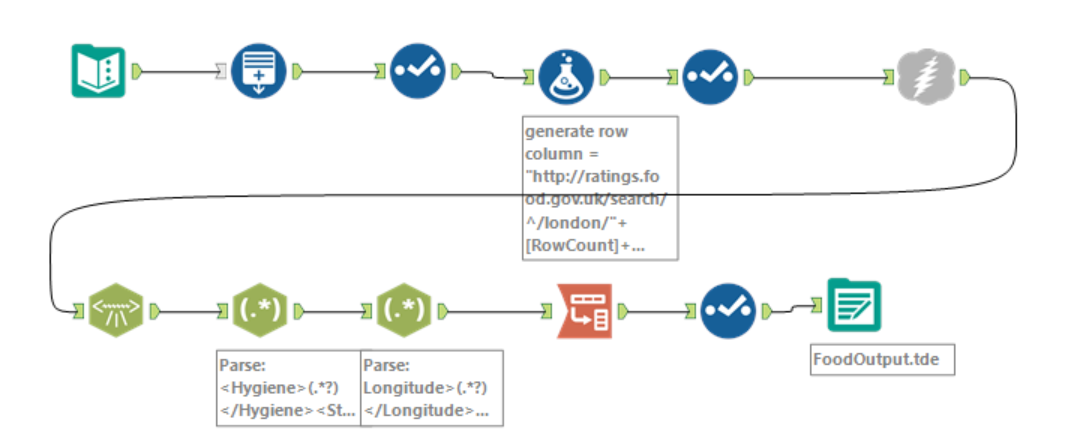
Conveniently, the Food Standards Agency publishes their results and they can be accessed via an API. To download this data and transform it into a Tableau friendly format, I created the following Alteryx Workflow:

First, I generated rows. This allows me to replace the page number in the API-URL and therefore access the data over multiple pages. Each page has 1000 records. After the data has been downloaded, the XML-Parse tool did most of the data preparation for me. Fields like business name and business category had already been parsed out. However, the columns score and location needed special attention. I used the Reg-Ex tool to parse out the messy data inside those columns.
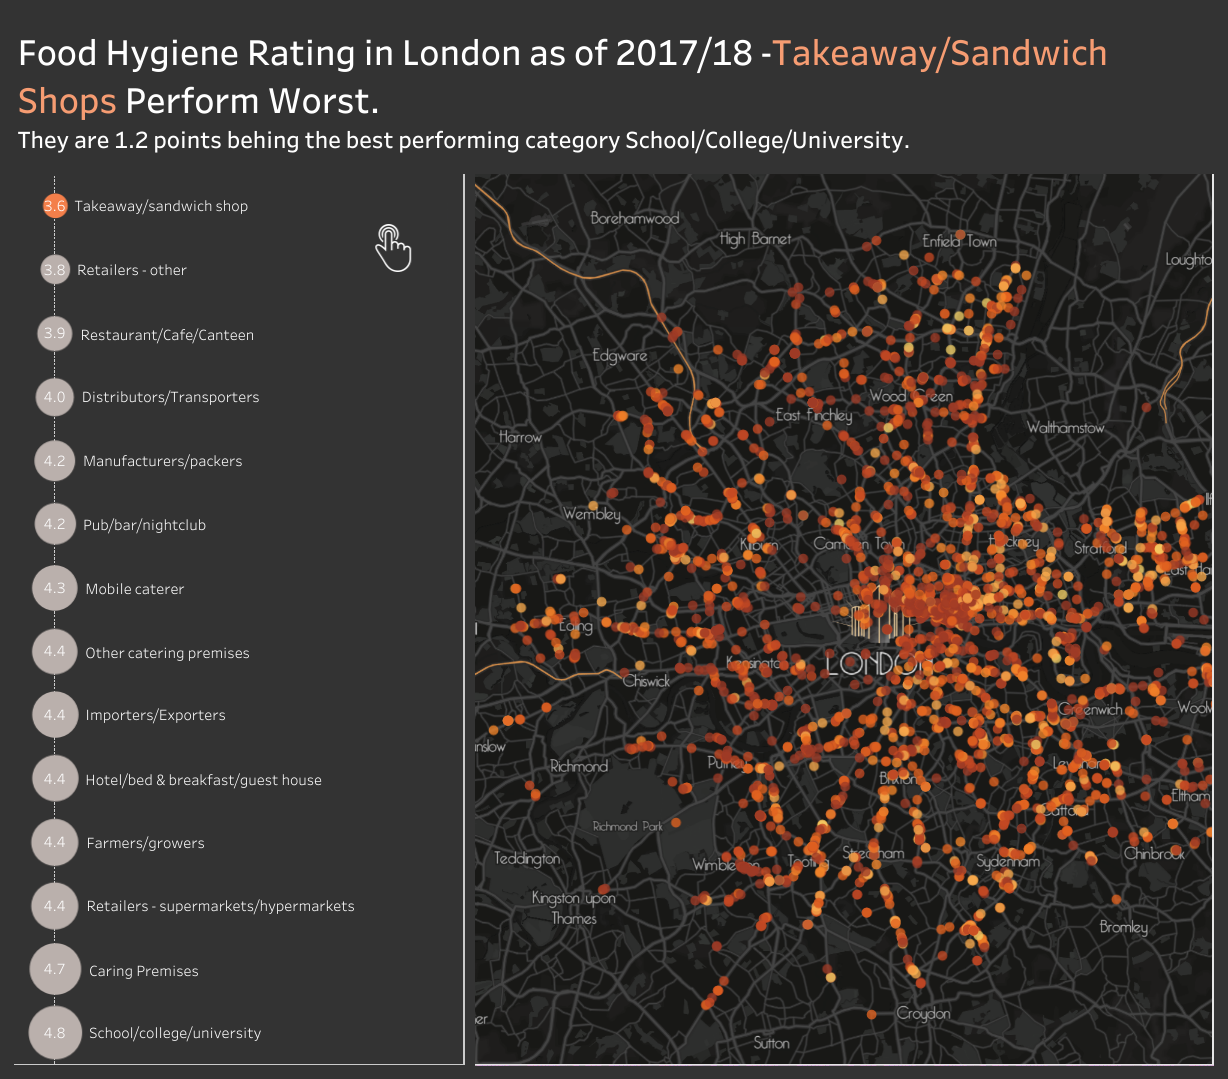
Now, that the data was cleaned, I opened Tableau and started visualising the data. I focused on the average rating per business categories. The bubble legend on the left provides an overview of the average ratings by business category and serves as a filter at the same time. By clicking on one of the bubbles, the map filters for businesses in just this category.

