Our final challenge before beginning full-time at the Data School was to complete either a Workout Wednesday, Macro-related Alteryx Weekly Challenge, or a Preppin’ Data challenge. I chose to tackle a previous challenge that I was unable to complete to see whether I had improved my data-prep skills. This blog post will walk through how I solved this challenge.
The Challenge:
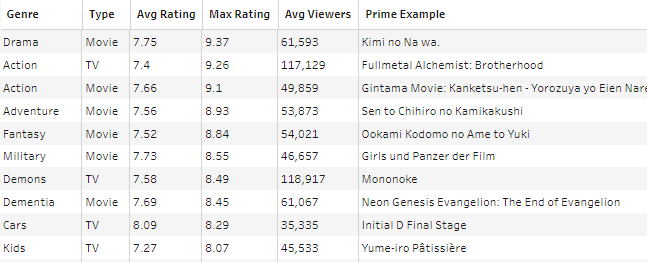
Preppin’ Data’s successful company, Chin & Beard Suds Co, wants to release its own anime series, and is doing some research before deciding the best genre and type of anime to release. With data provided from MyAnimeList, the challenge was to return a dataframe with some model examples of good tv shows/movies for each genre, with their average rating, viewership, and further the highest rating show/movie.
Initially, I had struggled with understanding when and how to pivot data, and also how to take advantage of joins when extracting additional information (in this case, the name of the maximum rated show/film for each genre). Since we have been working on a lot of Alteryx and Tableau Prep, I felt more confident tackling this problem, and managed to successfully arrive at the final output.
My Workflow & Steps
The first step I took was to read the requirements from the blog post, which tells us to only consider
- Shows with more than 10,000 viewers
- TV Shows and Films
- Anime that has ratings, excluding all null values
- Anime that has a listed genre
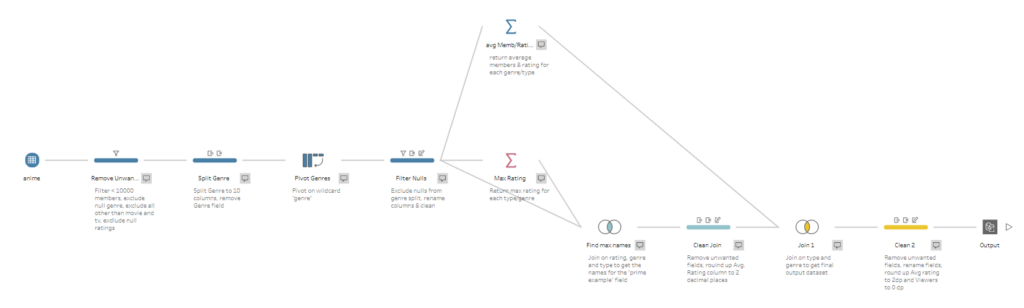
Therefore, the first step was to filter data based on these conditions, which reduced the dataset to ~2000 rows. The next stage in the workflow was to split out genres, since in the original field they are merged into 1 column. To solve this, split the genre column to 10 separate columns, using the delimiter ‘,’. This leaves us with a lot of empty columns, since only a handful of the observations had more than 5 different listed genres. Instead of manually excluding all empty observations, I pivoted the data first, then handled this problem.
To pivot the data, I transposed the dataframe based on the wildcard ‘genre’. This means that the data will transpose all columns that were split from ‘genre’, all in one step.
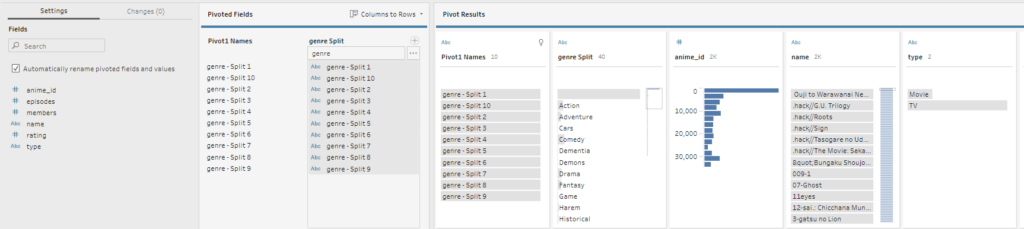
Then, I added a clean step, and removed all empty observations from the ‘genre split’ column, and cleaned up the names of the columns. The data is now ready to be aggregated, in order to gain average viewership, rating, and further the ‘model example’ anime show name.
Summarising the data
My first approach here was to try and complete all of this in one step. However, Prep does not allow you to summarise the same column multiple times. After getting frustrated, I looked back at the blog post which suggested using multiple steps for this, which helped me arrive at the correct solution.
First (the easier bit); summarising the average viewers and the average rating for each genre and type (show/film). This returns 77 rows, and I knew I was on the right lines since the expected output also contained that number.
The next step was to get the maximum rating for each genre and type of anime. This was simple, but the problem now was how to return the name of the anime with that maximum rating. Since we do not group by show name, we need to find a way to join our data with our un-aggregated data with multiple conditions.

I eventually realised that I could join based on type, genre, and rating, which would only return the rows where the rating matched the maximum rating. This allows us to locate our ‘prime example’ anime, which is required for the final output.
After this join, I used a clean step to fulfill the conditions of the challenge – rounding maximum rating to 2 decimal places, removing unwanted columns, and renaming certain columns to help with the final join. It is now time to join this flow with the average rating and viewers flow.
This join was based on genre and type, which gives us our (messy) output dataframe. We now need to clean the output, by removing unnecessary columns, rounding our average viewers and ratings column, and renaming columns to match the specific requirements from the challenge.
Overall, I am feeling much better about using Tableau Prep & data preparation tools in general. I think I would’ve given up quite quickly if I had tried this a month ago, but writing out the steps really helped to clear things up in my head!