


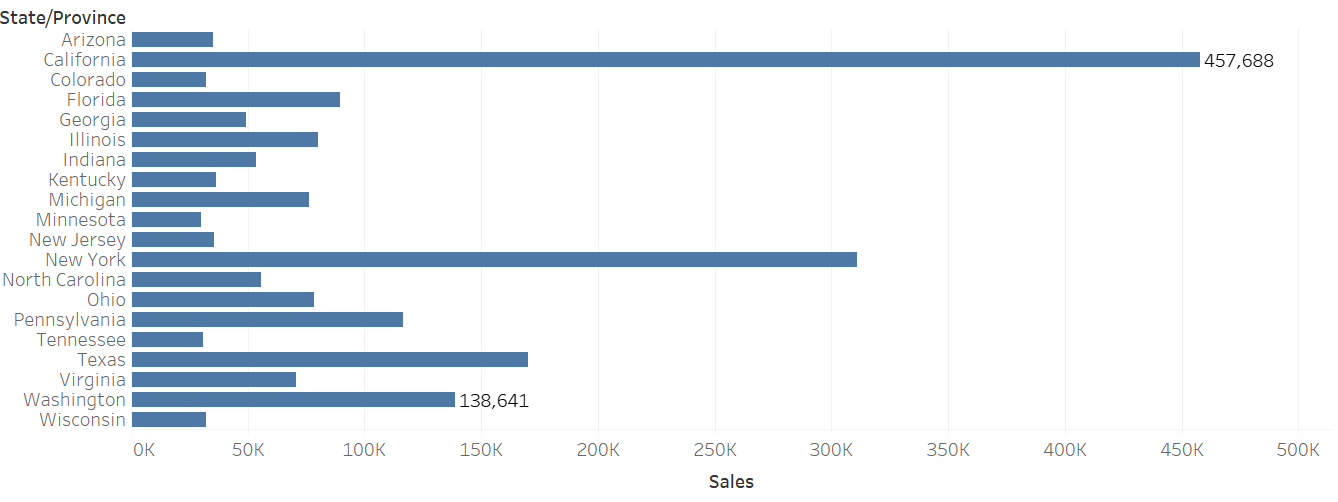
The following graph shown below shows the top 15 states by sum of sales with the first and the last bar highlighted to show the value.
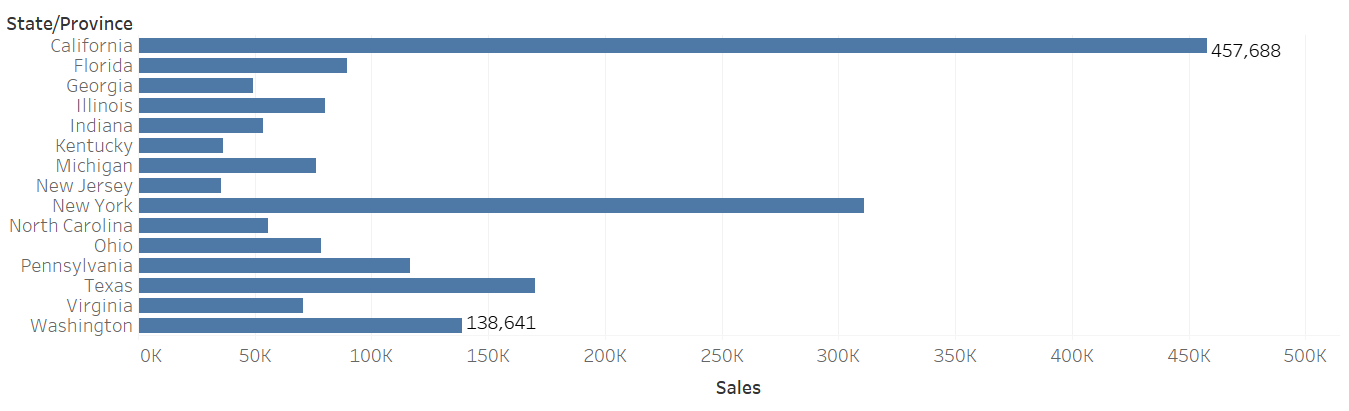
When I first got asked to make this I highlighted California and Washington (click one, hold control select another) then right clicked and changed mark label to always show.
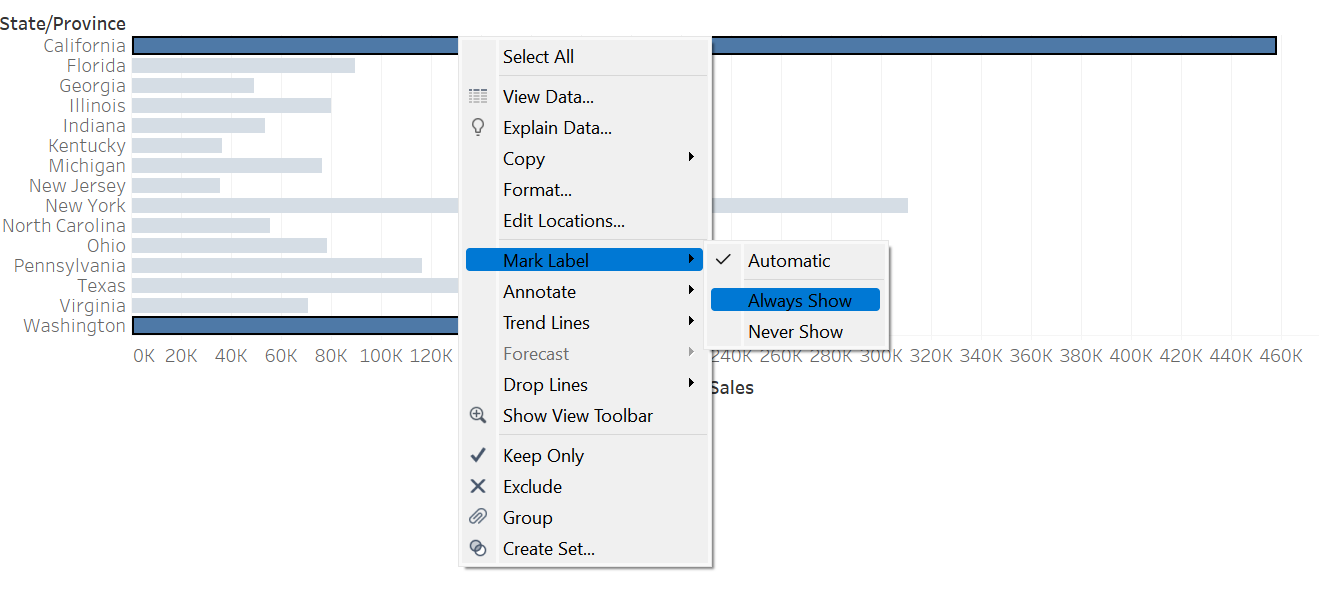
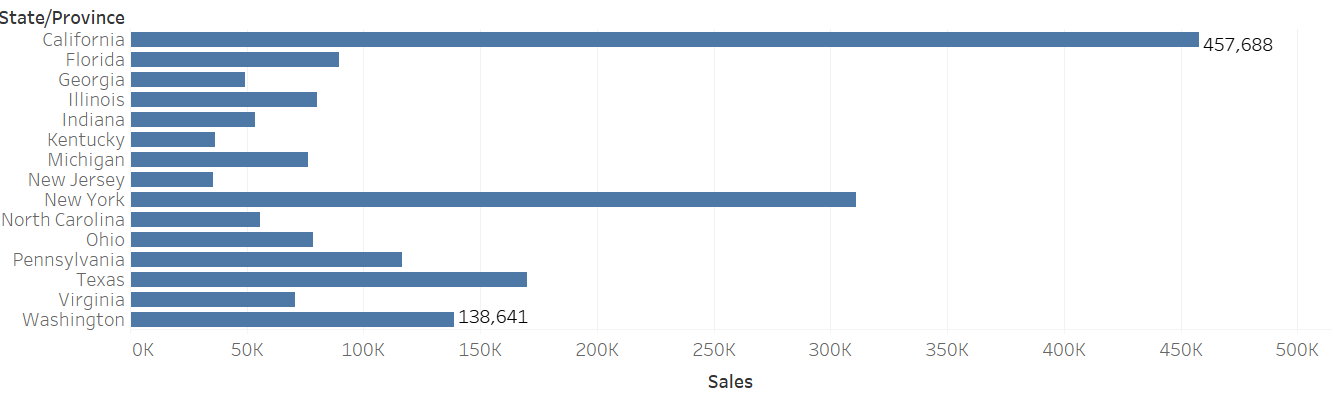
Which produced the following:
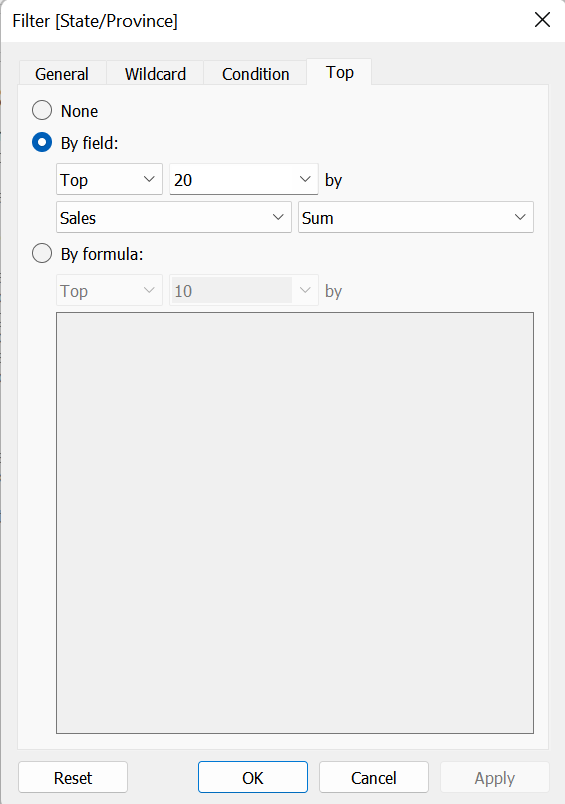
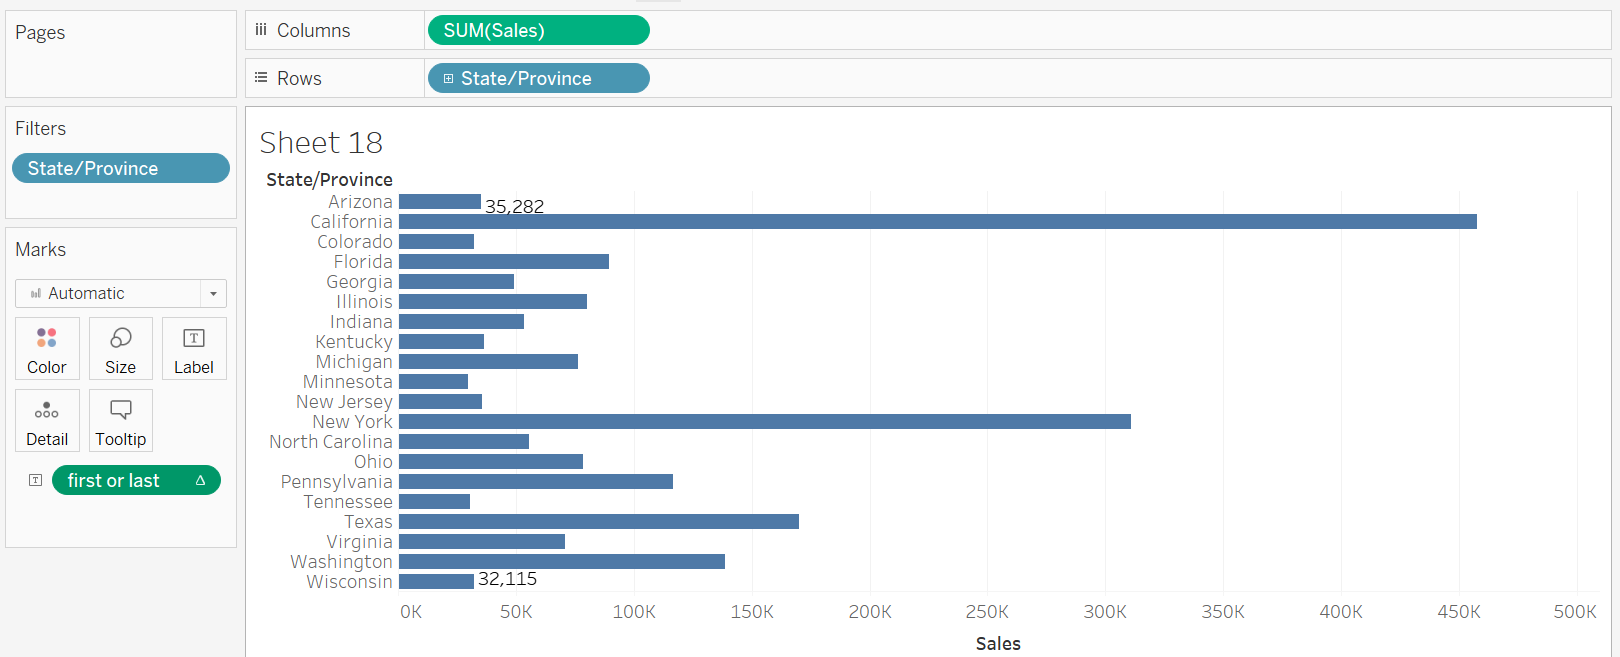
and I thought it was as simple as that. But then in my session for table calculations with Erica she pointed out though this worked for this example this is not dynamic which means if more data was to be added to this the last bar would not be picked it would still be on Washington and California. As shown by the following when I change the filter to top 20.
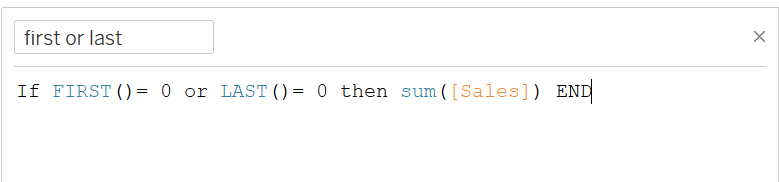
So using a table calculation would be the better way to approach this to make sure it stays as the first bar and the last bar. For this calculation we need FIRST() and LAST().
FIRST(): this returns the number of rows to the first row in the partition so setting it to 0 to create a label for the first bar.
LAST(): Returns the number of rows from the the current row to the last row in partition so setting this to 0 will bring the bottom bar.
This therefore creates the following for top 20:
Now finally if we change the filter back to top 15 we can see that it keeps the first bar and the last bar.
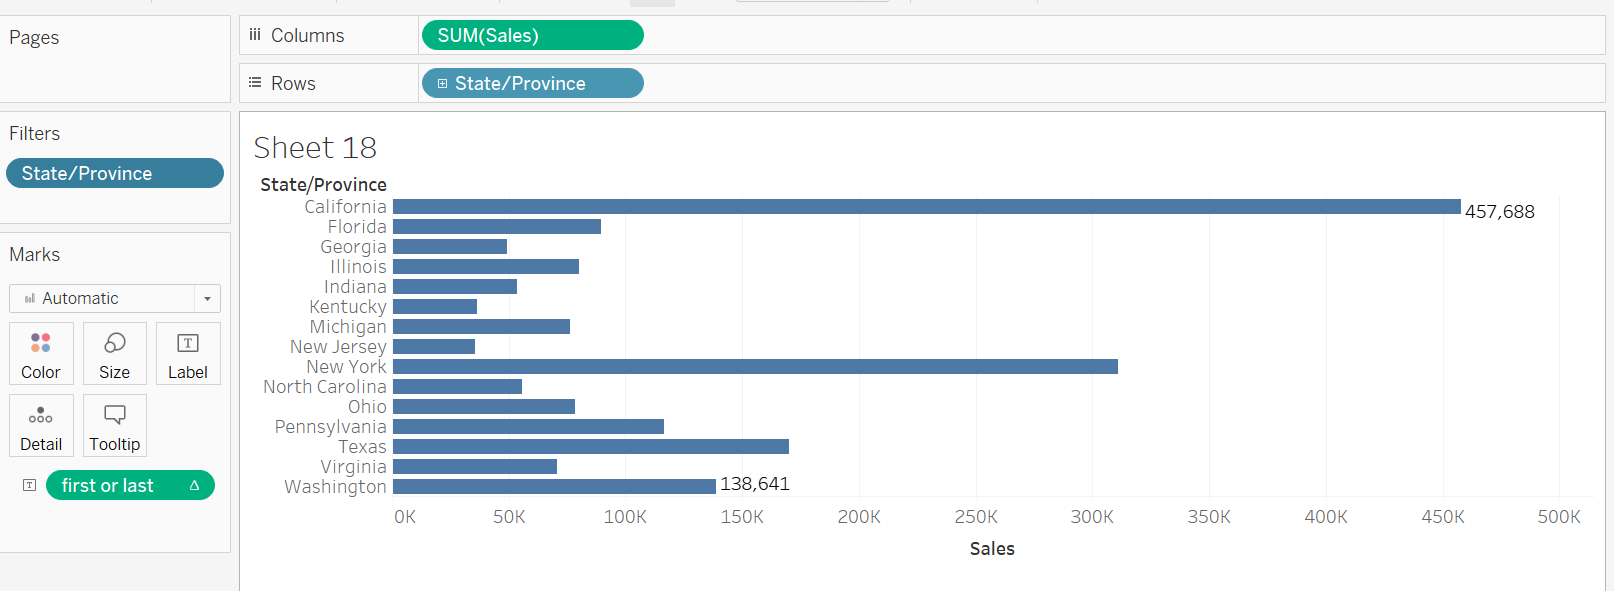
Now this is a more dynamic way for keeping the label for only the first and last bar and will change even if the there is more data added or taken away.