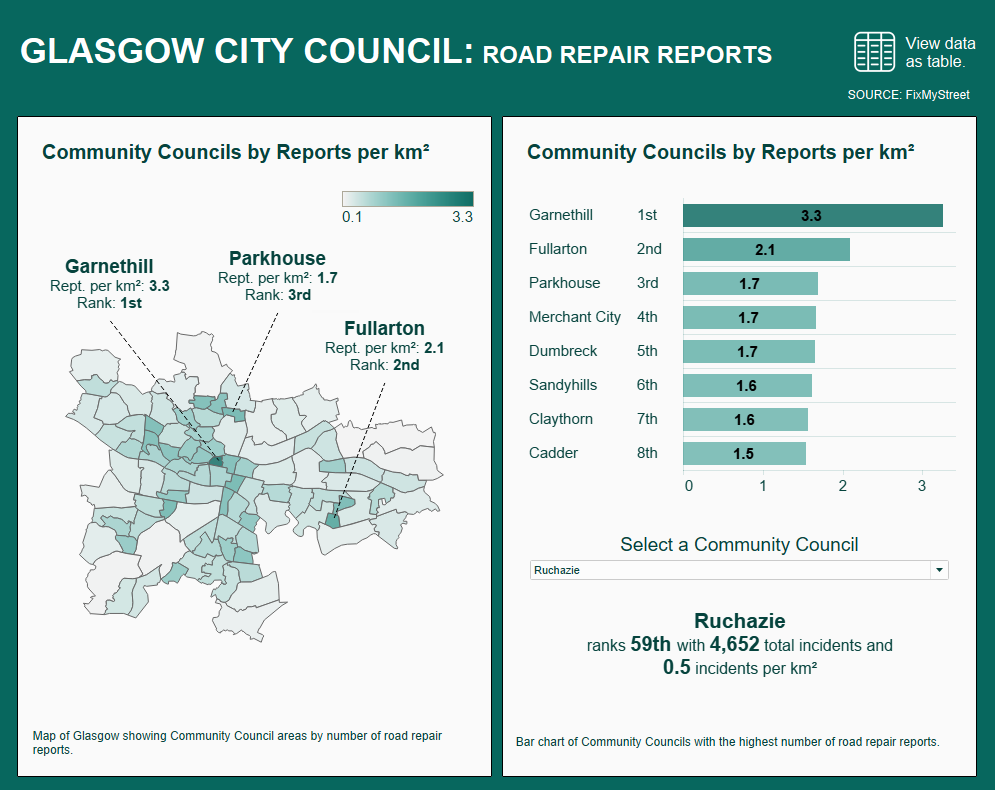
Today's task was to develop a dashboard based on reports of road failures in Glasgow. We were also asked to integrate accessibility features into the final product. First of all, the data we received was geocoded. As such, it would have been a missed opportunity to leave out a map from this vis. I started by downloading and joining spatial files for Glasgow's Community Councils to our original dataset. Then I used the Spatial Match tool in Alteryx to group geolocations. I used the AREA function in Tableau to determine the size of each geographical zone which I, in turn, used to calculate the number of reports per square kilometre.
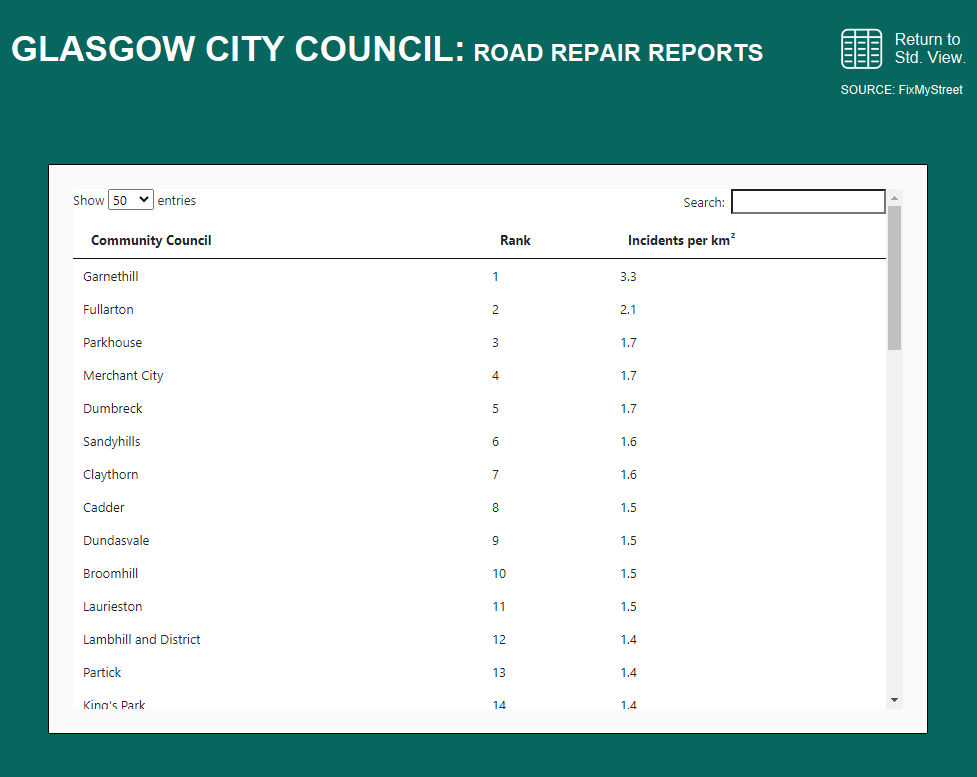
The following few hours were spent producing charts which included several accessible attributes. For example, the workbook font was set universally to Arial, a well-known font which promotes easy reading for impaired individuals. Font sizes were kept above standard for similar reasons. The entire dashboard was also made to be navigable using only a keyboard, an important feature for those with impairments to motor control. All data was also accessible in cross-tab format. This was implemented using the DataTables Tableau extension and was made available under a navigation button.