


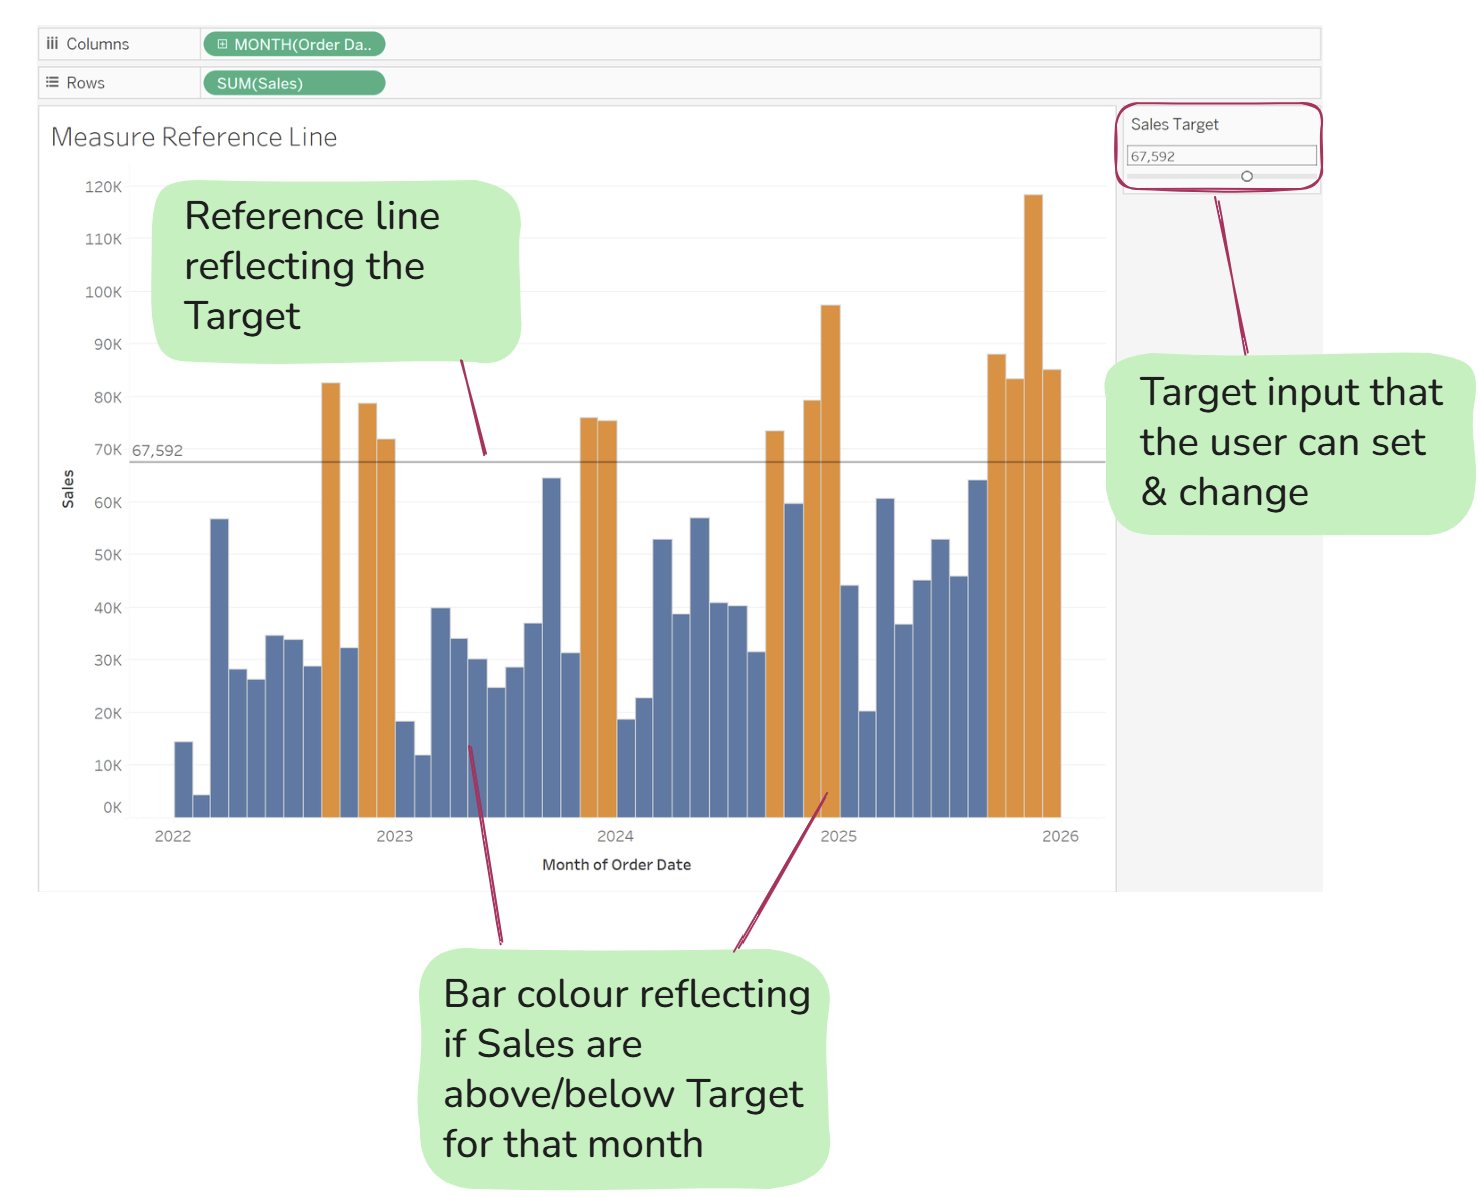
Parameters in Tableau can be used for many different things. In this example, I want to enable the user to:
• Set their own target sales
• Add in a reference line to reflect the target
• Set the column colour to reflect whether the sales are above or below the target line
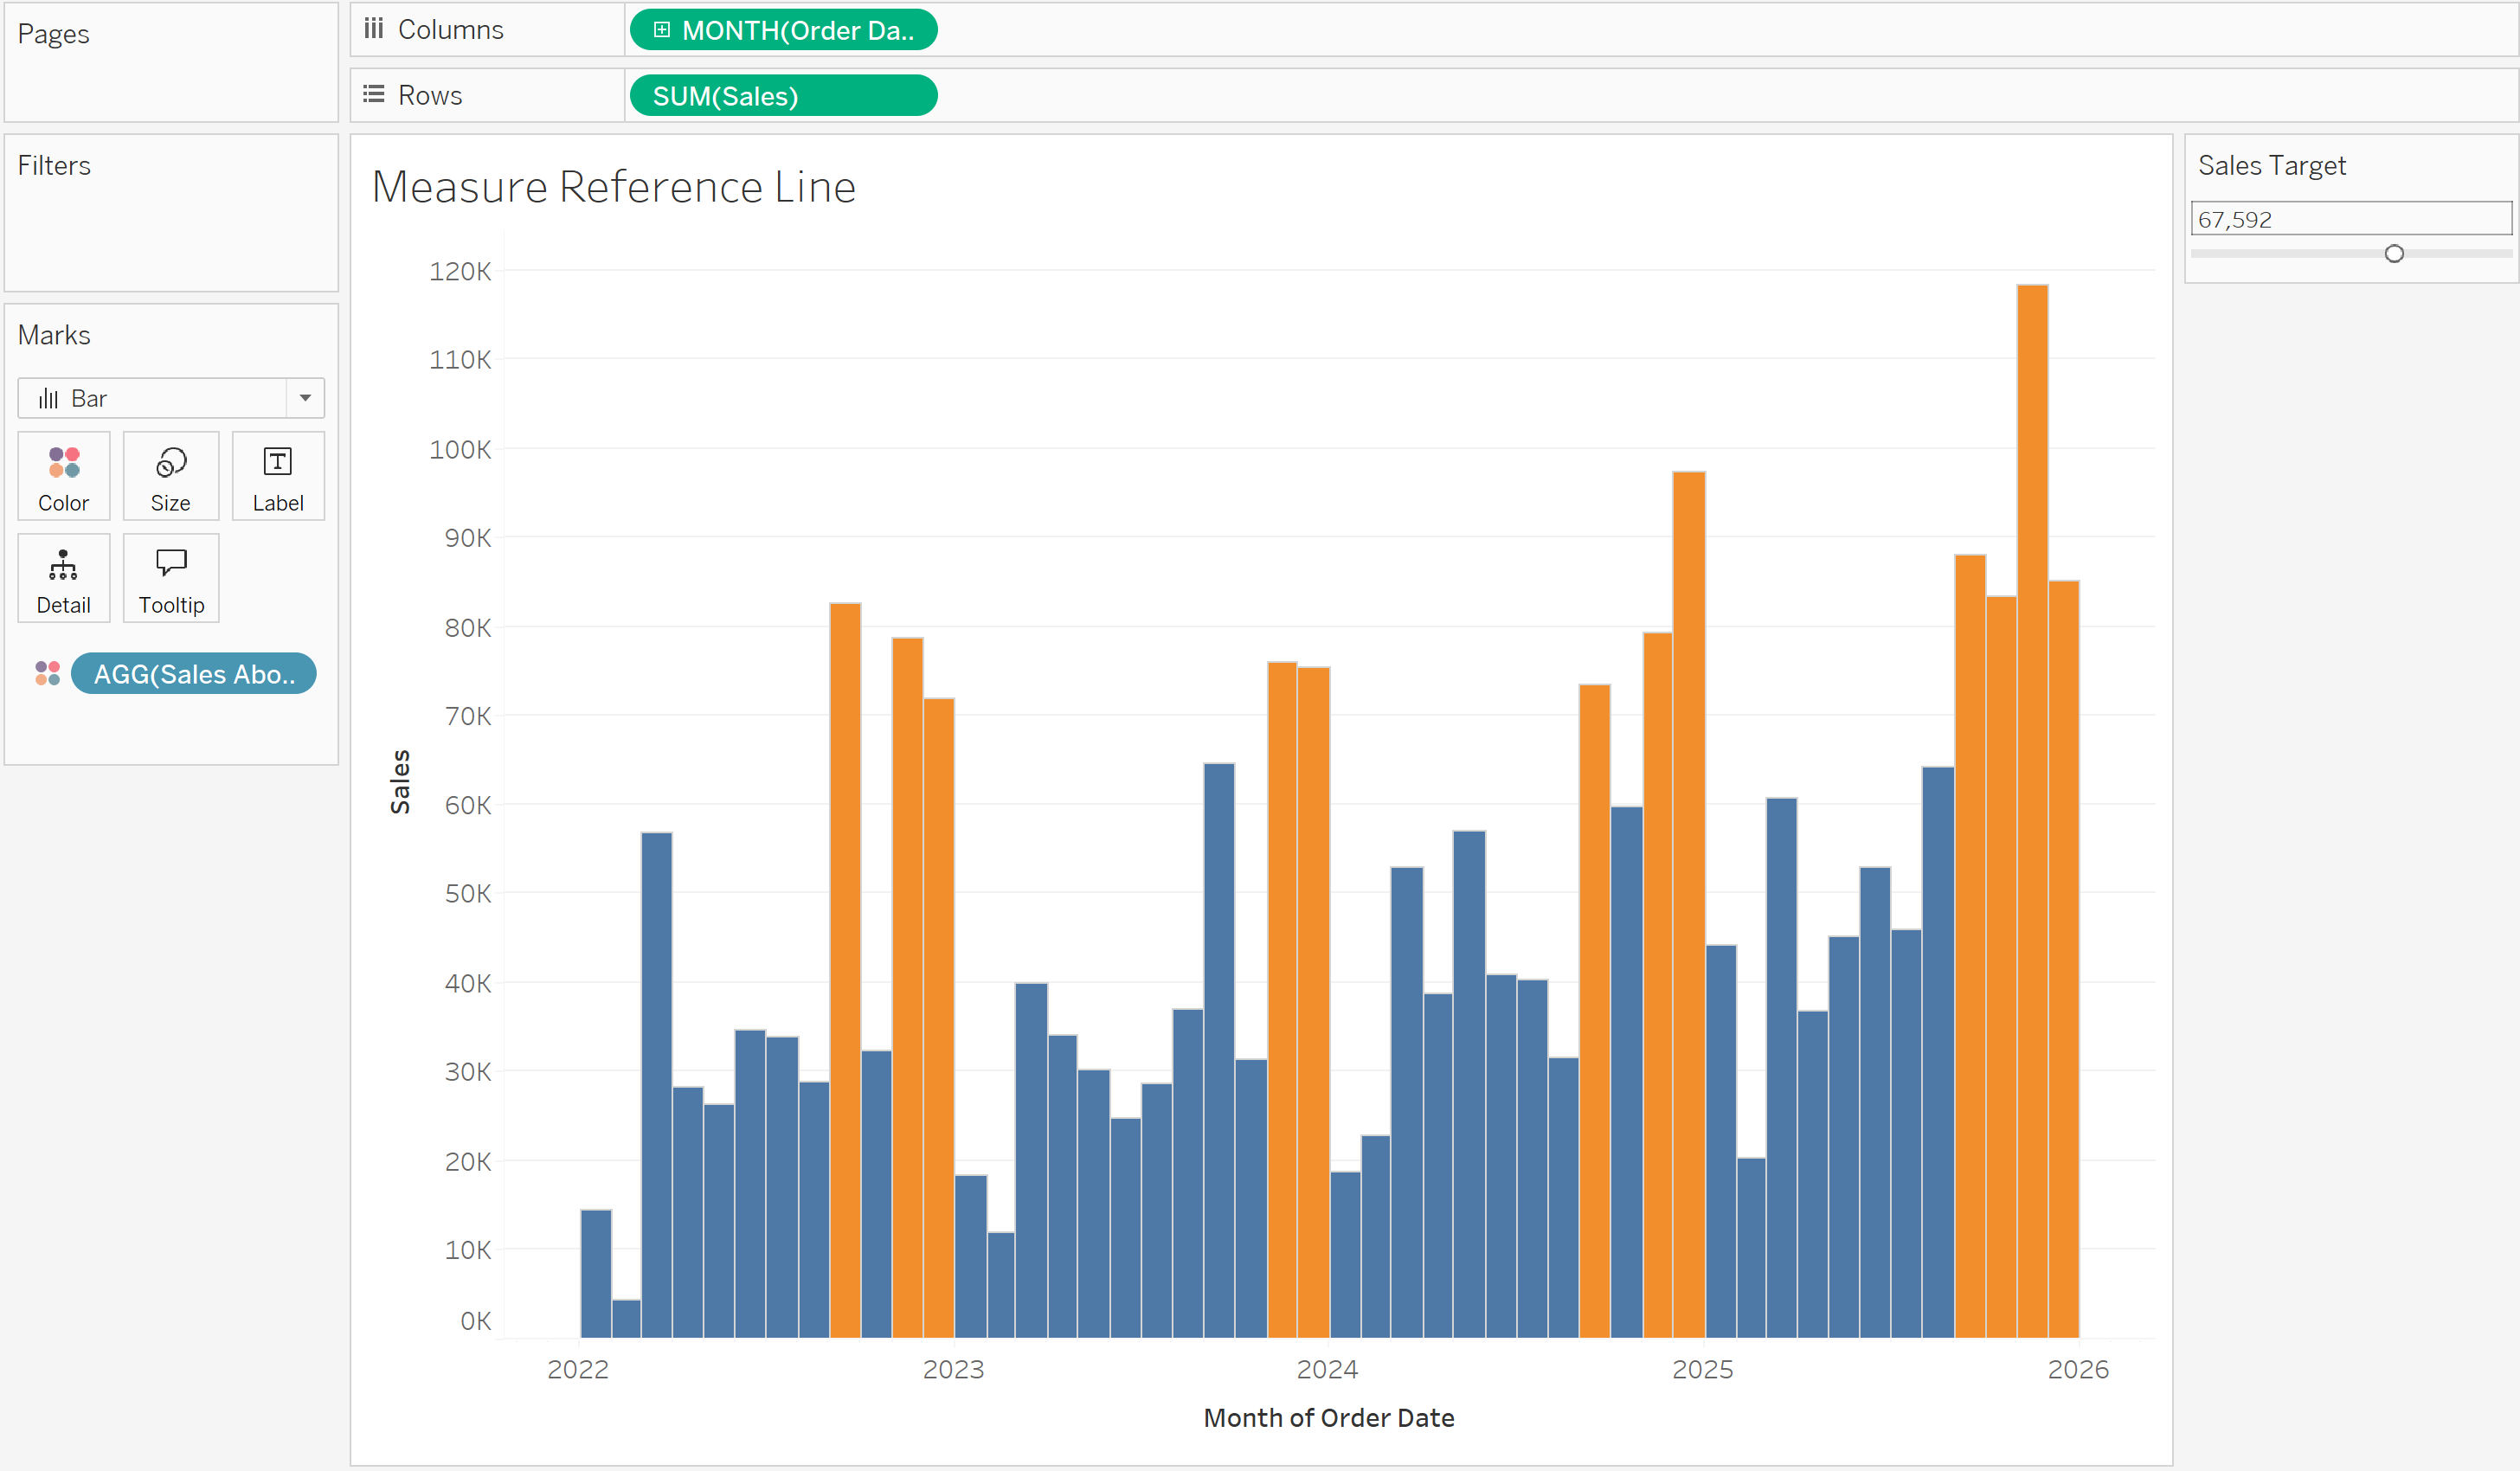
The desired chart would then contain all of the below elements:
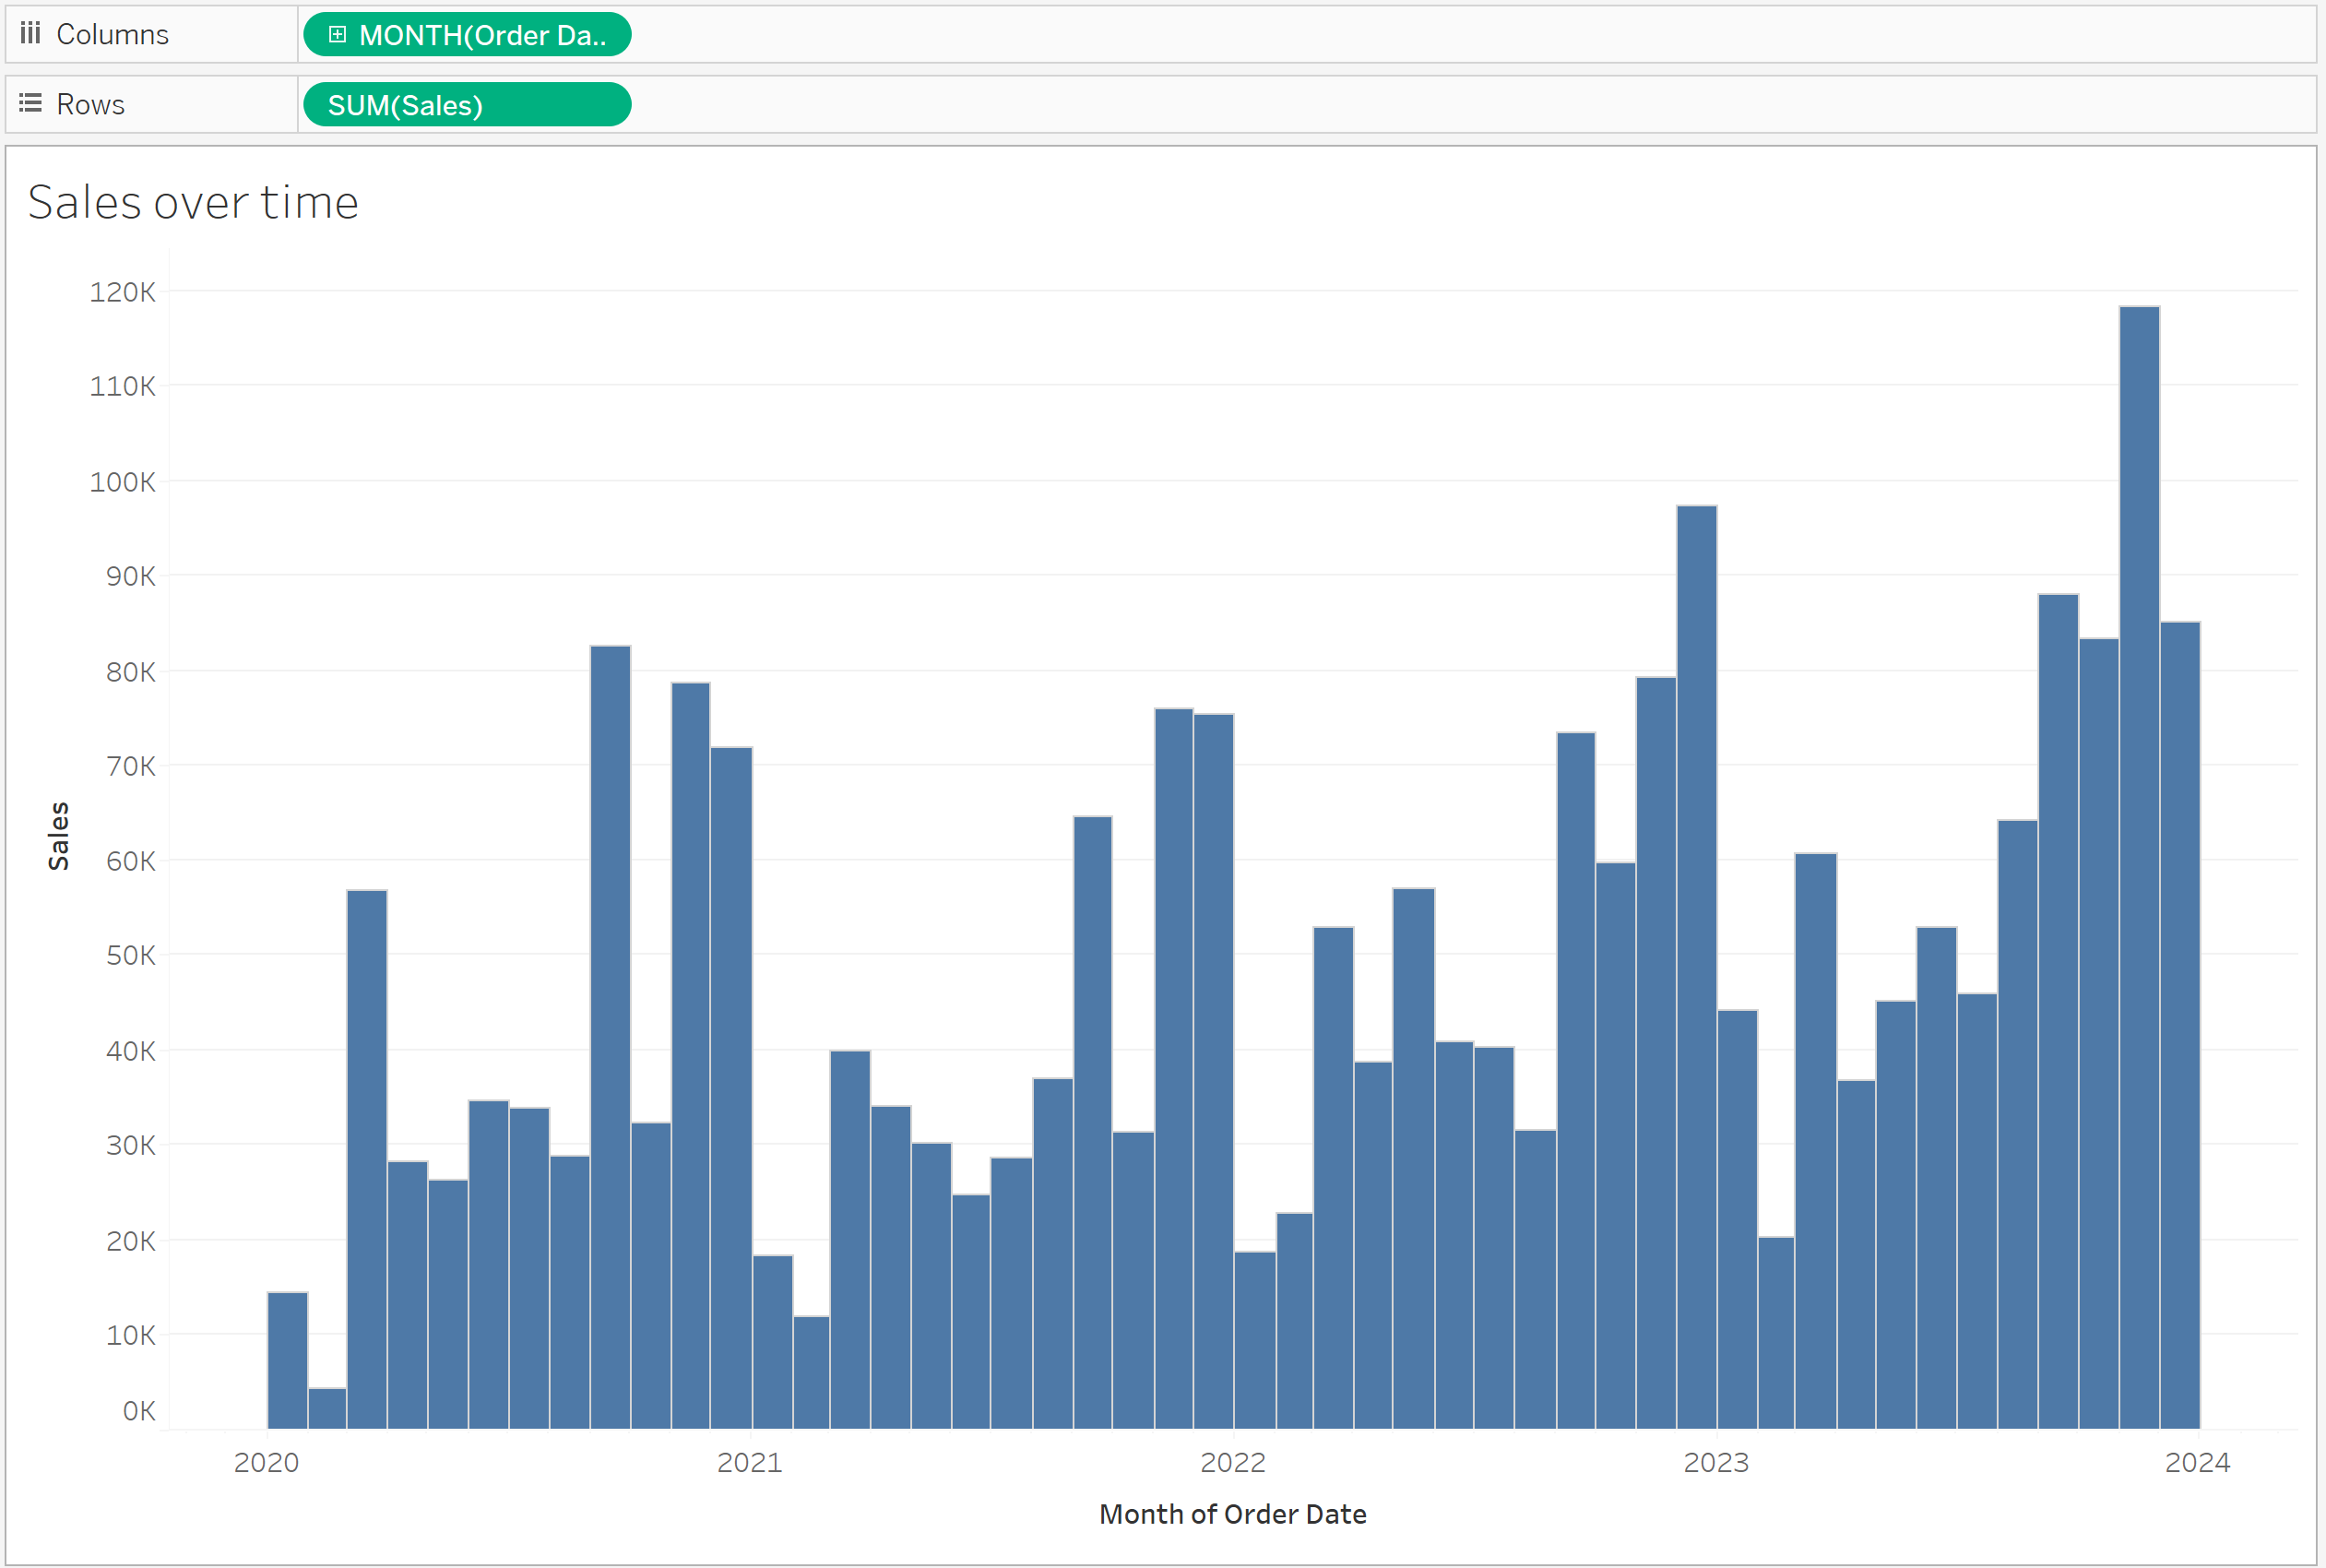
Starting with plotting sales over time on a bar chart:
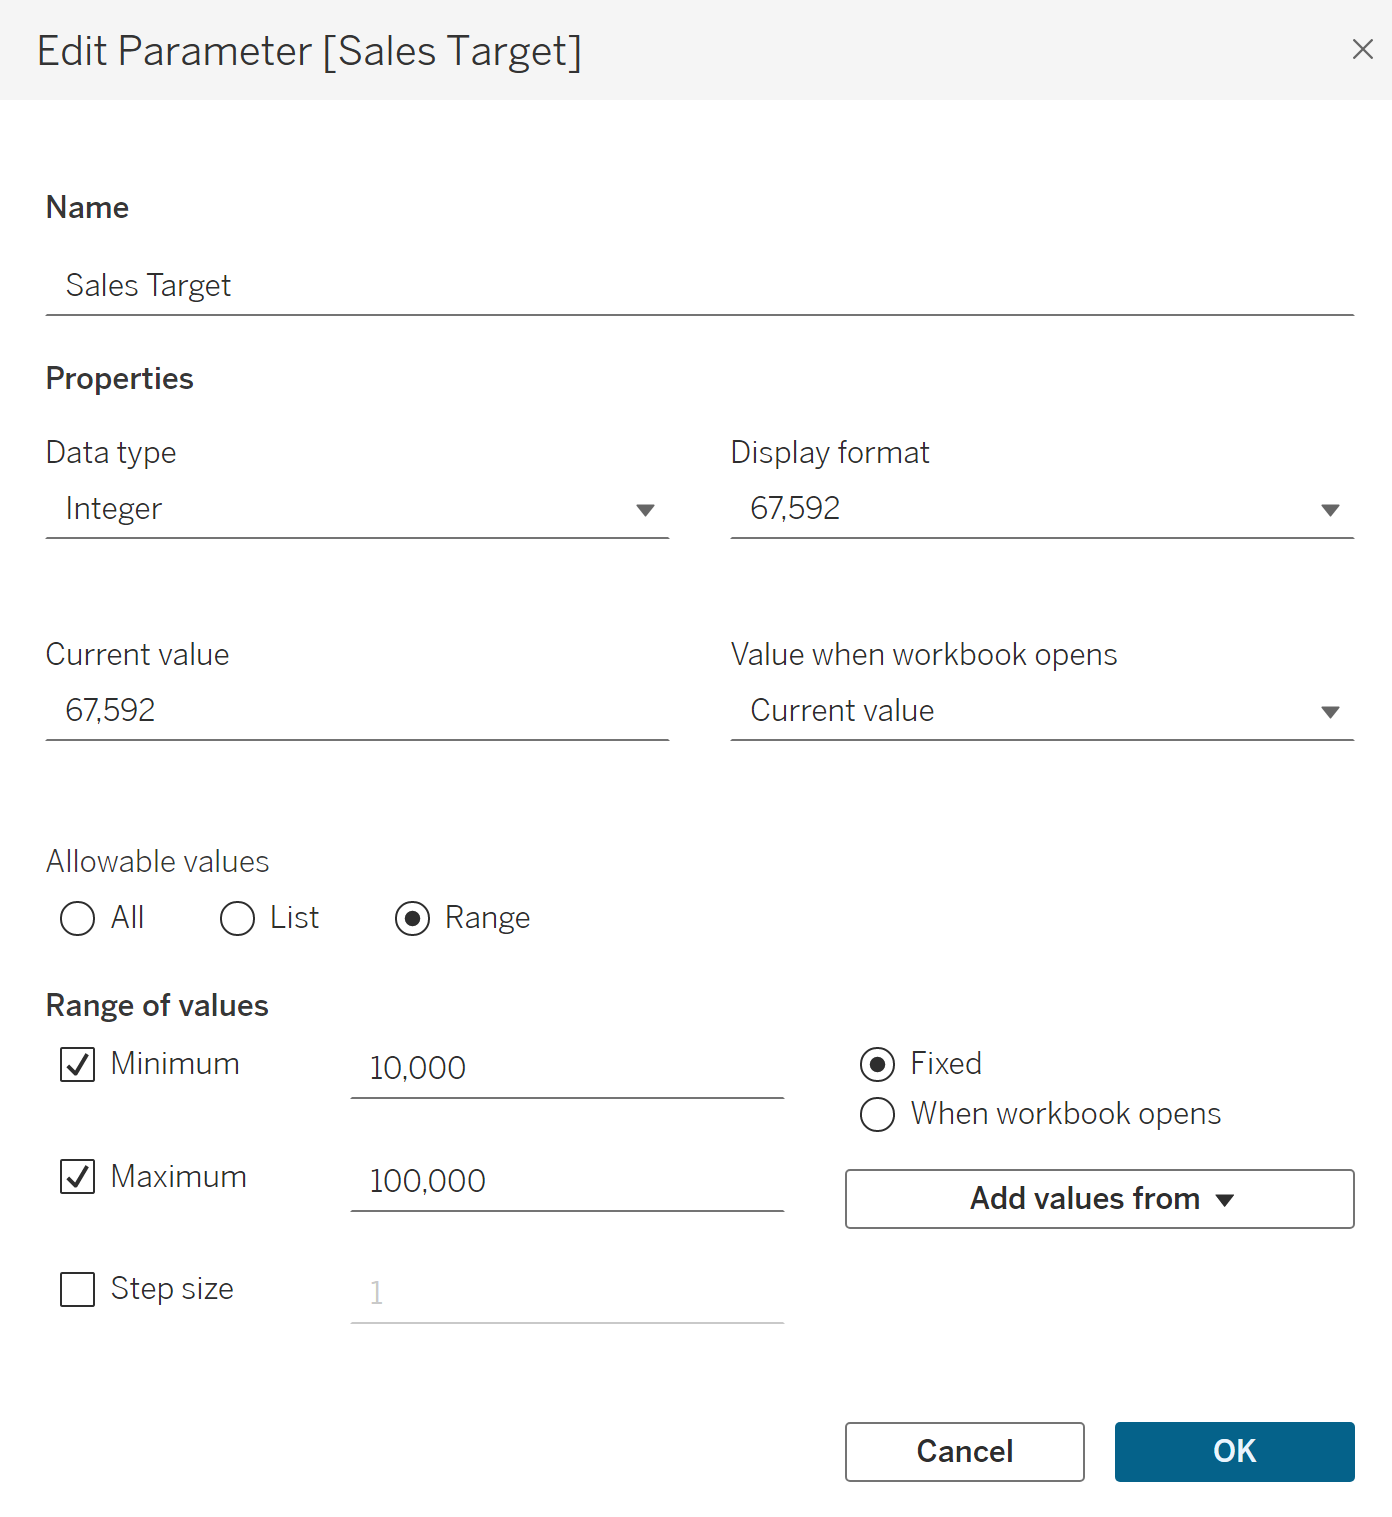
First, create a parameter and name it 'Sales Target' - set the range according to the minimum & maximum sales in the data
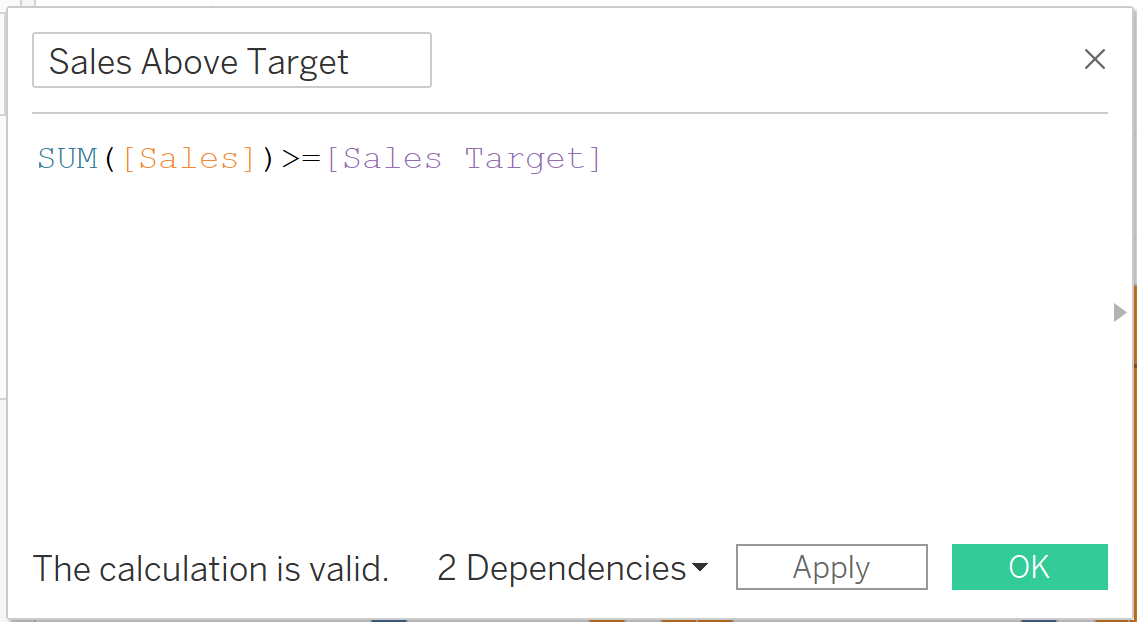
Next, combine the parameter with a calculated field in order to link the parameter up into the view. Select 'create calculated field' and name the calculated field 'Sales Above Target.' The calculated field is stating:
‘the sum of sales is greater than or equal to the sales target parameter’
The answer to this statement will be a Boolean, which means the answer will only be ‘true’ or ‘false’ - or ‘yes’ or ‘no.’
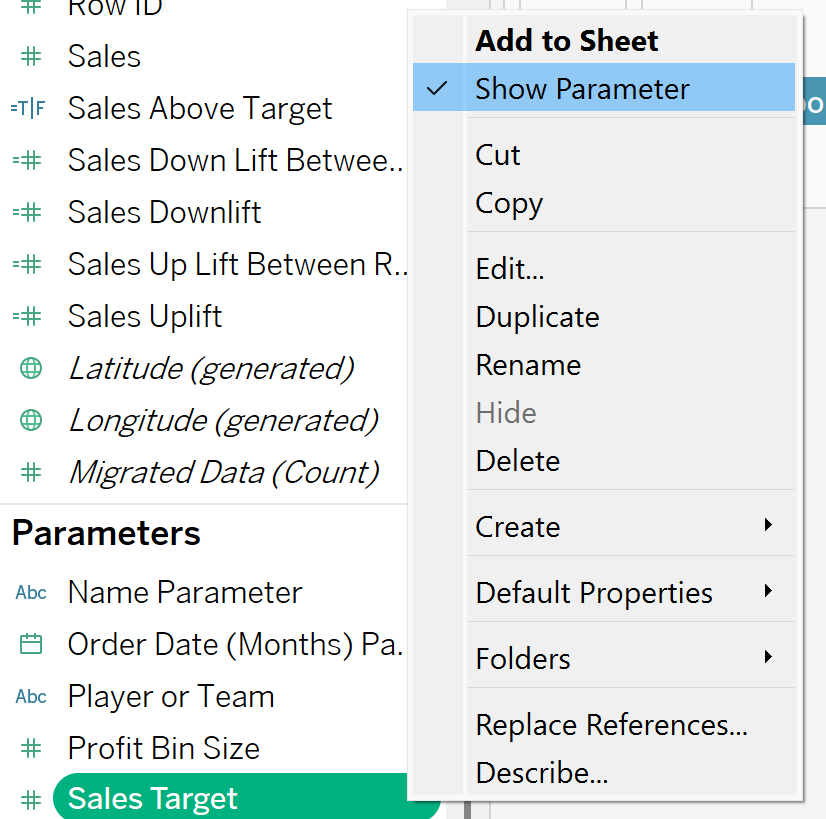
Click on the parameter, and select 'show parameter'
Next add the 'Sales Above Target' calculated field onto the colour mark. Adding both the parameter and the calculated field onto the view, enables the user to both change the target parameter input, and the bar colour will reflect if the sales value is above or below the target:
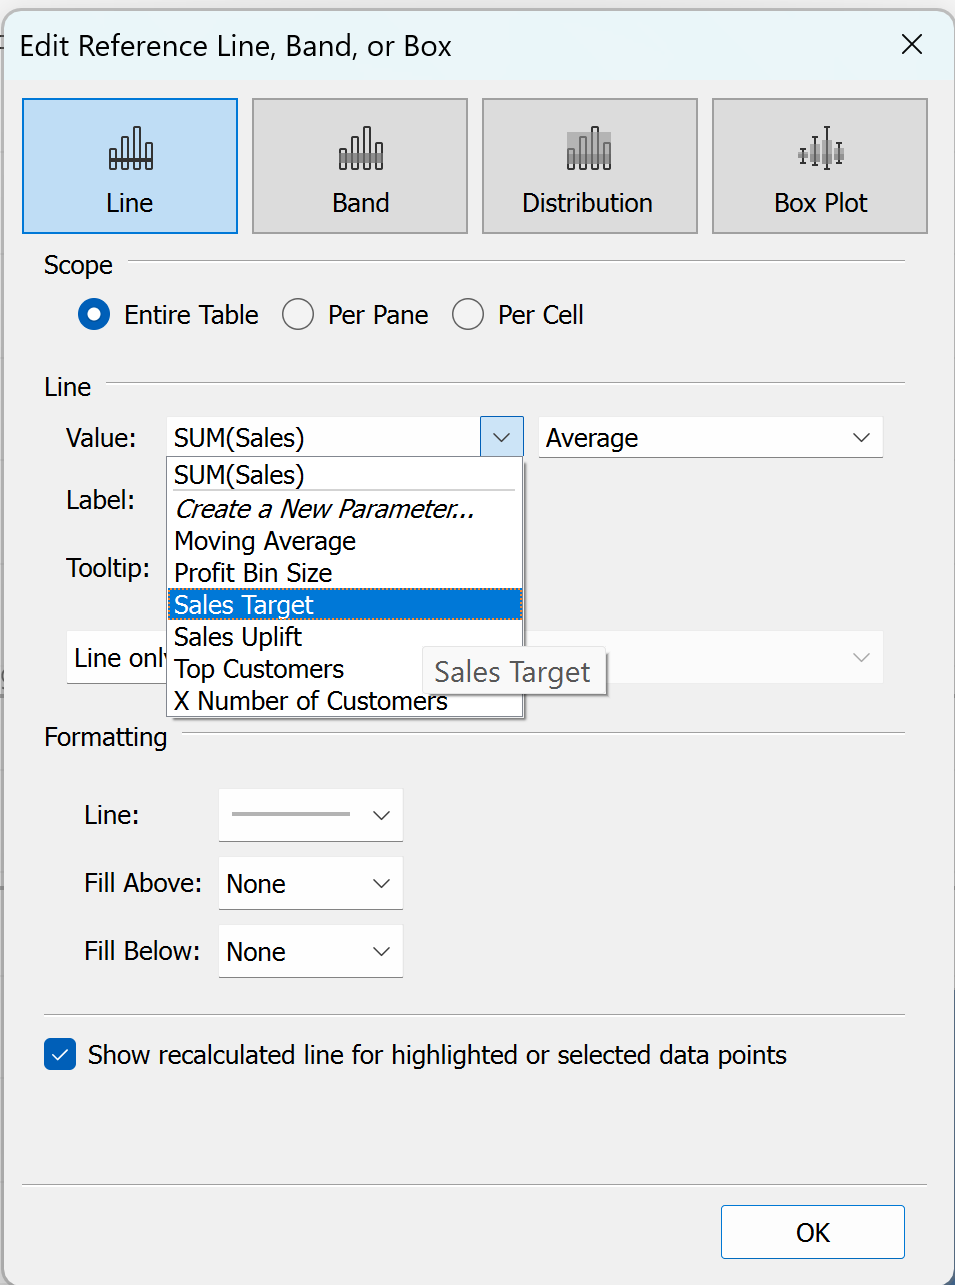
Now it's time to add the reference line. Start with selecting the Analytics data pane, and dragging a reference line onto the chart, selecting the entire table - in value, this is where you can link the line up with your target parameter:
That's it! Now you have all the desired elements on your chart. Now your user can:
• Set their own target sales
• Add in a reference line to reflect the target
• Set the column colour to reflect whether the sales are above or below the target line