Last week Friday project consisted into creating a dashboard sketch on paper canvasses and to then replicate the work into Tableau.
Earlier this week I already blogged about the utilisation of sketches in data visualisation and their benefits. You can find this blog post at www.thedataschool.co.uk/alessandro-costanzo/data-preparation-for-dummies
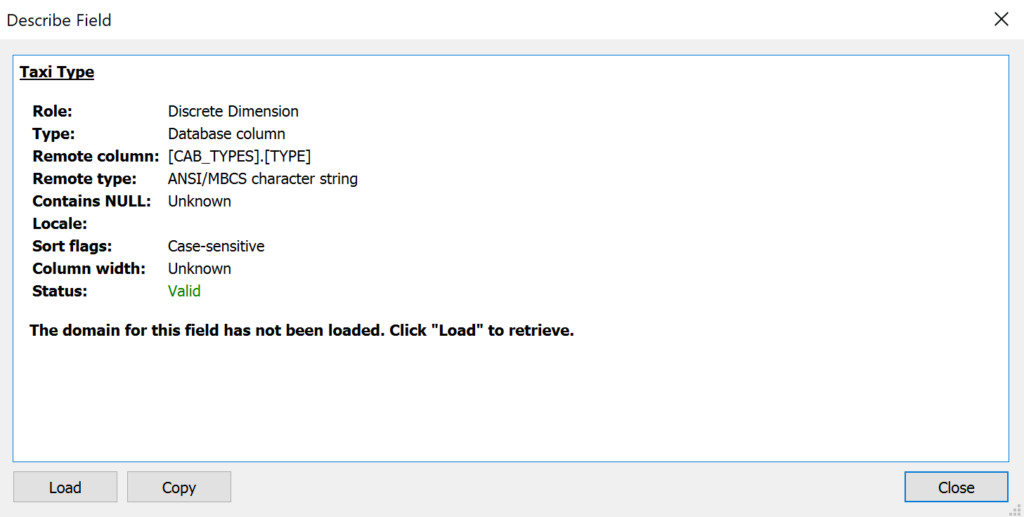
Unlike the previous exercise, this time we worked on actual data, and for the first time as DSers, we connected to an external database (Exasol). It was interesting to see how this process works, reinforcing the theoretical explanation we’ve received earlier this week. After connecting with the database, Andy only authorised us to only check the field description, and forbid us to start building views in Tableau.
To access this menu you need to right click onto the desired field and press the last option, Describe. This will display a summary showing various characteristics of the field, and a sample of the fields elements.

Given the enormous size of the database, Andy suggested us to avoid visualisations which would plot every entry (e.g maps).
I therefore, made notes of the field, and after some background research, I started to think which fields I could have used to build my dashboard.
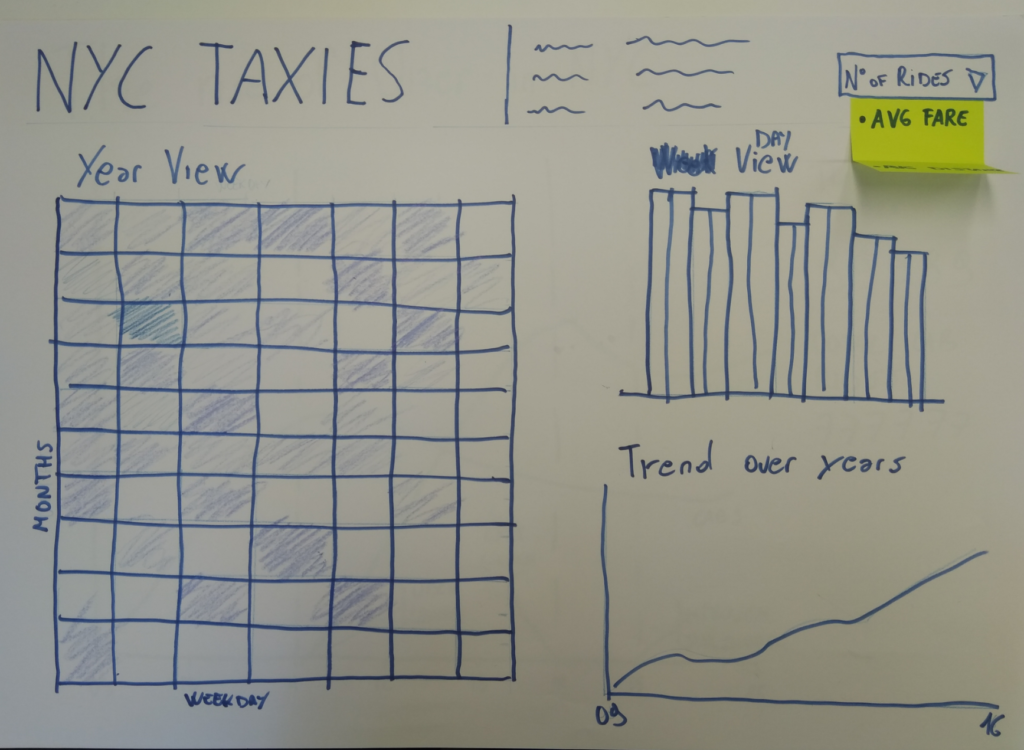
I initially thought to build two dashboards, an exploratory one which would display patterns among three different measures (number of rides, average fare and average distance), and another explanatory one in which I would describe the rise of Uber against regular taxis. Here you can see the sketches I made after my brief analysis.
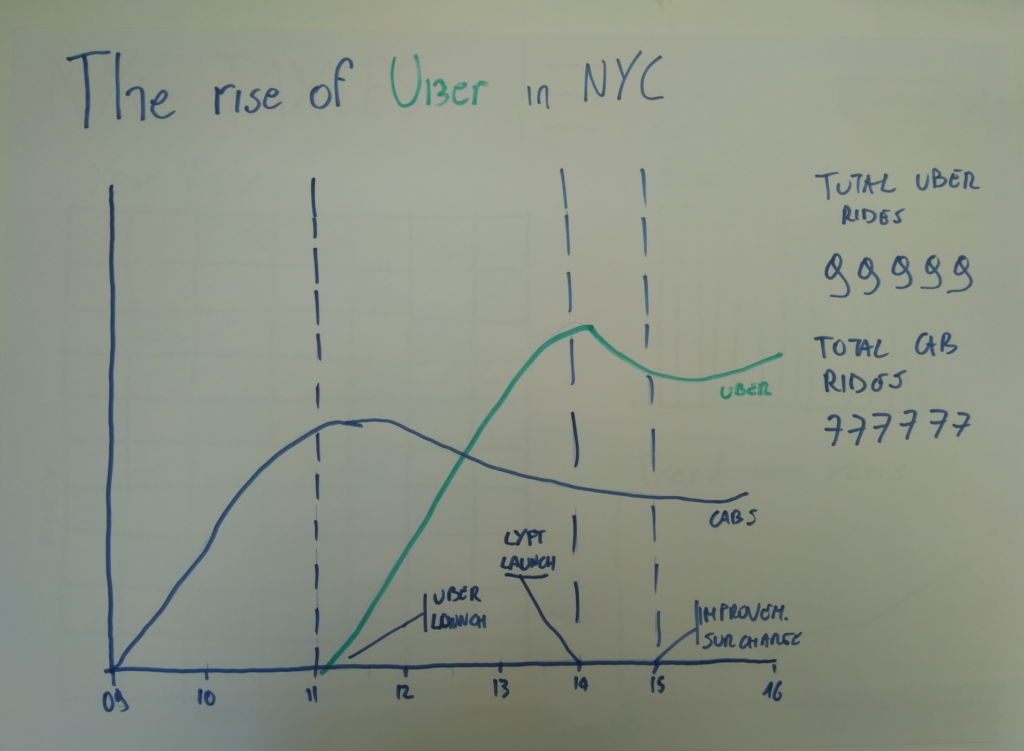
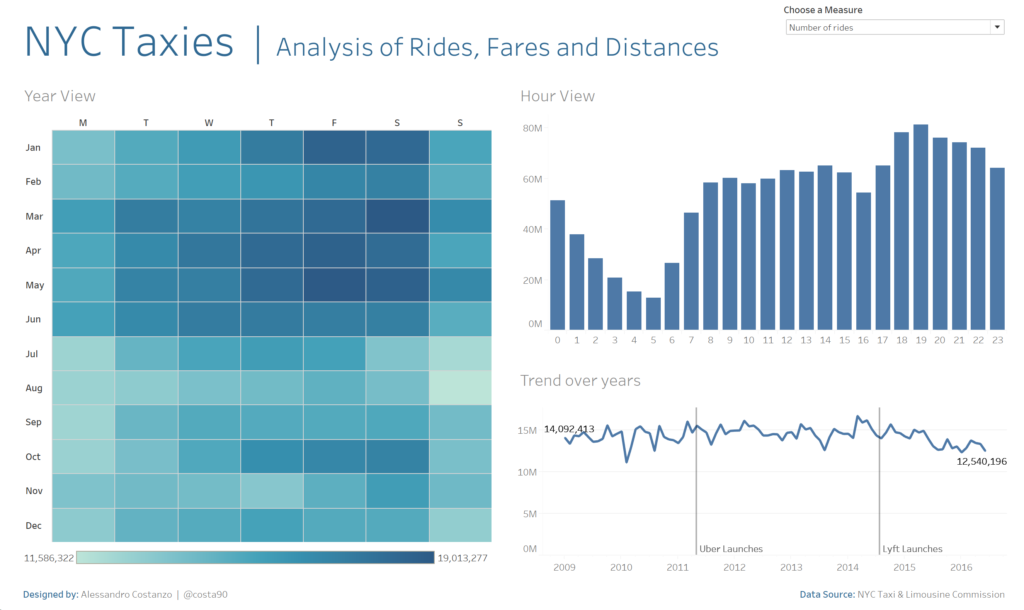
After this process, I started to build the actual dashboard on Tableau. Unfortunately, I only managed to recreate the first sketch, because despite Uber was shown in the sample of data, all the entries were nulls, making comparison impossible. Despite that, I decided to re-utilise some ideas I draw in the second sketch (reference lines for the launches of Uber and Lyft).
Here you can see the final result.
As usual, we presented our dashboards to our peers at the Data School, which questioned stylistic and analytical choices. In my opinion, our group felt much more confident compared to the previous week project. I noticed that everyone had improved their time management.
I believe that drawing a sketch of the dashboard has actually helped us a lot in this regard. Having a clear idea of the kind of visualisation to pursue allowed us to focus on this, rather than creating several views and then selecting the most appropriate ones.
I have already used the sketch technique in the past, for my application and interview vizes, although I never used it for projects under a tight time schedule. This experience reinforced the usefulness of this method, which I’ll definitely use for future assignments.