


First Steps:
Ok so by now you should have the basics nailed, you can set up a simple bar chart, maybe you have played around with the “Show Me” function, and most importantly, have a grasp on what the Tableau Starter Kit has to say. From here we are going to look at some of the nifty things Tableau can do, some of which may have been covered in the Starter Kit (it’s always being updated) and some that most certainly is not!
One thing you may have noticed is that Tableau does not have a grid view or any kind of ruler function, so if set up your dashboard to “float” the worksheets etc. that you bring into it, you have to line them up by eye. No it’s not just you, I must have spent a whole day looking for something like this. But fear not, the end is nigh! In the current beta Tableau has introduced (along with a host of other cool functions) a grid view! Hooray! Now you just have to wait for the next version to be launched….
Right, on with the show.
As we start every Tableau journey on the Data Source page (once you have uploaded an input of some sort), we shall start here. For the most part of this series we will be working with the Tableau provided, “Superstore” data file unless otherwise stated, of course you can generalise these tips to whatever you are using.
Once you have picked and dragged across your chosen sheet, there are a couple of features to take note of. The first is the “Connection” buttons, if you are online when opening this dataset, it should automatically set itself to “Live”. For the most part we won’t need to change this unless you are working for a large international![]() country and your data is being bounced around the world (and thus is very slow to load). If this is the case, I will go into further details in the next blog post (and if it doesn’t apply to you then just skip that one if you wish).
country and your data is being bounced around the world (and thus is very slow to load). If this is the case, I will go into further details in the next blog post (and if it doesn’t apply to you then just skip that one if you wish).
Right next to the Connection buttons is a “Filter” function. This is different to the normal filters you play with when in a worksheet, if you add a filter at the level it applies to the whole dataset, and thus the dependant worksheets, from this point onwards. This can be useful when working with EXTREMELY large data files and you only want to use a part of it, as it will cut down the strain on Tableau to read the whole thing each time you create a graph. ![]()
Beyond that there are tools such as the “Data Interpreter” on the left hand side, which attempts (often unsuccessfully) to pivot the data to Tableau’s requirements if needed. The “Sort Fields” dropdown in the middle which lets you view the pane to your liking but has no effect on your worksheet. We also have “Union” on the left hand side which is great if you have multiple pages in your data that are linked by some continuous variable and are in the same format. For instance, if you have an excel spreadsheet that has a sheet for each year, you can select them all in union and Tableau will match up the rows accordingly.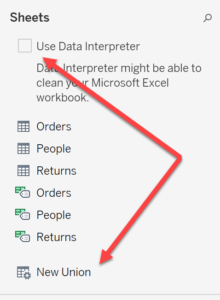
This is getting to be a rather wordy blog post so I will bring up the final item, if you decide that you need to bring some data in from a different source, but it does not use the same formats, rows or is just completely different to the dataset you are currently using, then if you press “Data” in the toolbar, and “New Data Source” it will allow you to run multiple datasets at once. However, bear in mind that when working on a worksheet, it can only handle data from one data source at a time. You can still bring these differing datasets into the same dashboard however.
Phew that was a lot! If you are ready to move on, then either check out “Extracts” or if you don’t think its applicable and you can’t be bothered to read it out of curiosity, check out “Data Properties”.