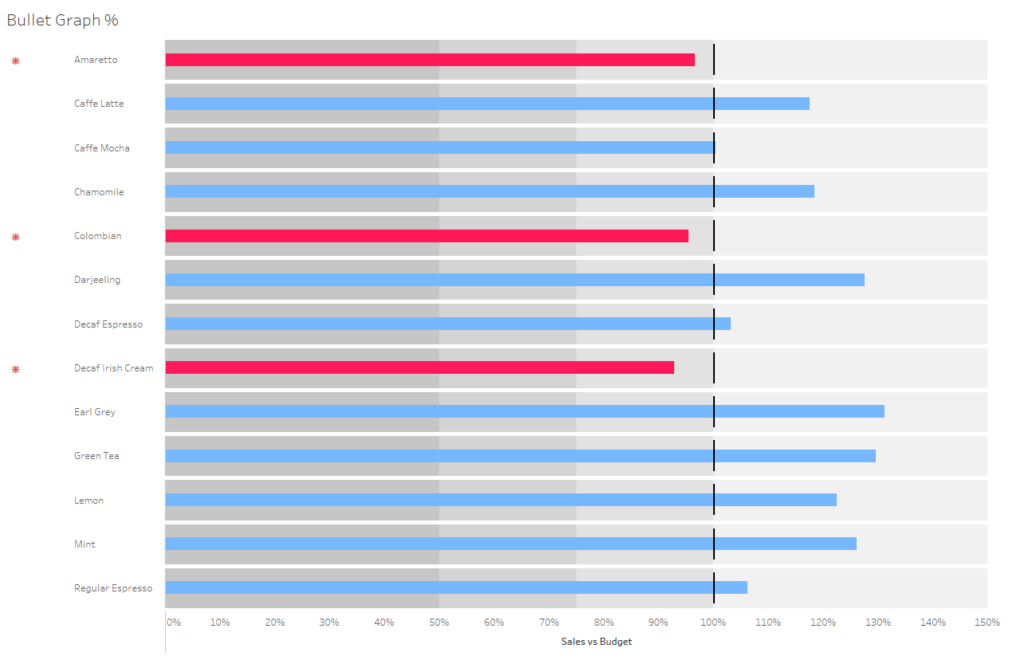
Hey! Today we learned about bullet charts. It seemed like a great way to cram in lots of information into a single chart so I thought I’d run through the process of making it so the public can also benefit.
Bullet graphs are essentially a bar chart of a single measure (Year on Year Profit etc) against a contextual measure (Budget/Target etc), with added background shading to enrich the analysis of progress (25/50/75% etc).
Here’s the example Andy found which we attempted to replicate;
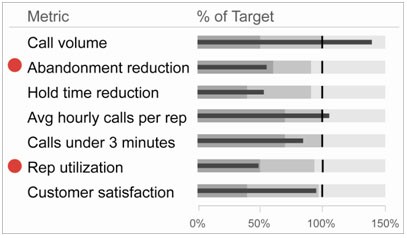
Step 1 – Make the Bar Chart
For this bullet chart, we will try a bullet chart using percentages. It just seems easier to compare budget in percentages rather than numbers as there is more context.
So all figures will be a % relative to the target. I’m using the coffee chain analysis so will simply create a calculated field with the expression;
sum(Sales) / sum(Budget)
Drag this onto your Columns shelf and your dimension onto rows (I’m using product), and you should get this output;
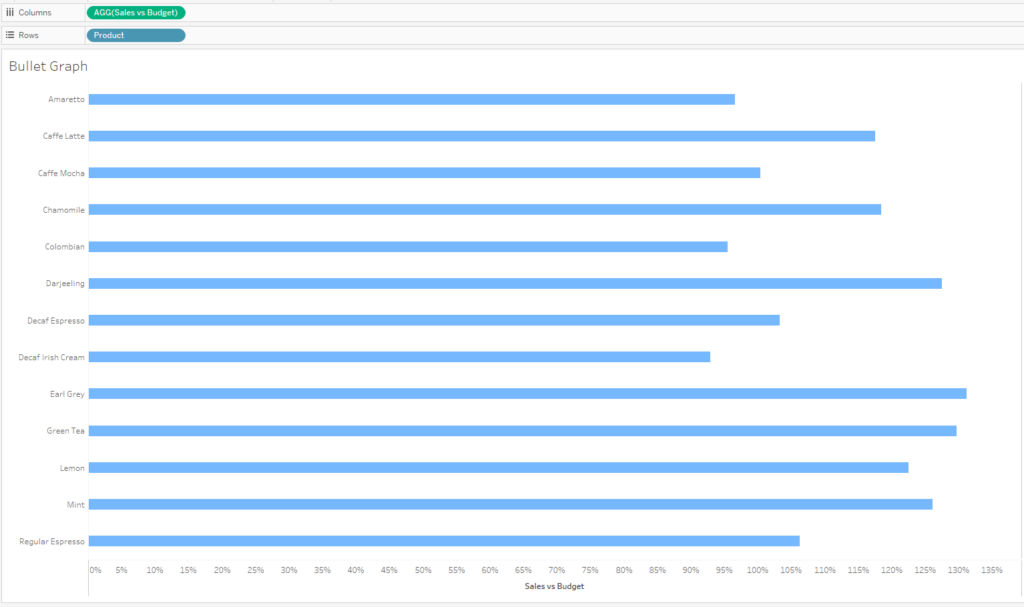
We now have the foundation. We still need to add context and progress shading.
Step 2 – Context
Firstly, we will add the 100% reference line. Or will we? When you add a constant reference line into the view you will get something like this;
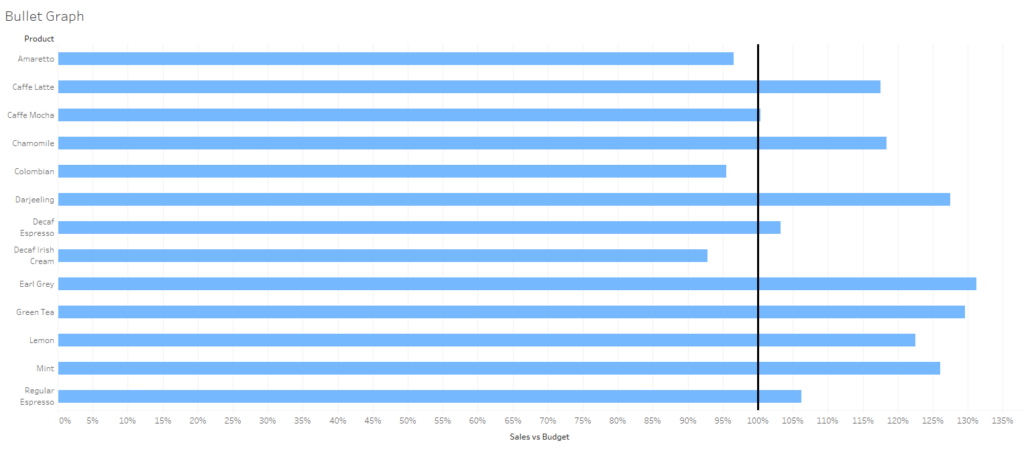
Now this isn’t exactly what we want. We want the reference line to be split up on each cell, even if all the values are 100%. We’ll have to use a dual axis.
There is four processes we have to follow here.
Firstly, a dummy variable in the columns shelf – I’ve gone for avg(1).

Secondly, change the mark types. The bar chart should be made a bar chart if it isn’t already (the default is sometimes automatic). The new field avg(1) should be made into a Gantt chart.
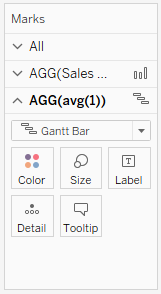
Thirdly, right click on the green avg(1) pill and click dual axis.
Lastly, click on an axis and synchronize. The rest is just changing the size until it suits your design.
You should end up with this (or close enough);

Step 3 – Progress Shading
A key benefit of a bullet chart is you can see shaded areas for when you are 50% off your budget, 25% over, or just completely blown it, so let’s add this.
Right click on your X-axis and click add reference line. Select the distribution band option. The picture below shows my selections but I’ll walk you through.
Bands will be shown for 50, 75, 100, and 150% of our 100% budget target. We have set the 100% by adding a constant of 1 in the value dropdown menu. Select fill below and take the labels and tooltips off.

This should be our output –
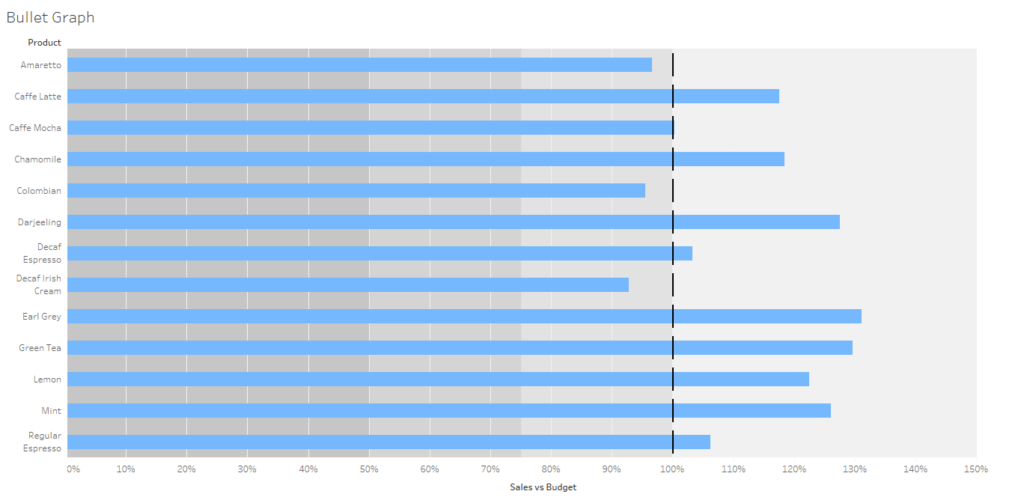
It’s not completed finished, but we’re getting close. Let’s add a few design tips to make this nicer.
- Add your Sales vs Budget field or whatever field you used for the measure onto colour. Make this a two step colour scheme (red and blue), and set the centre to 0. Now we can easily see underperforming measures.
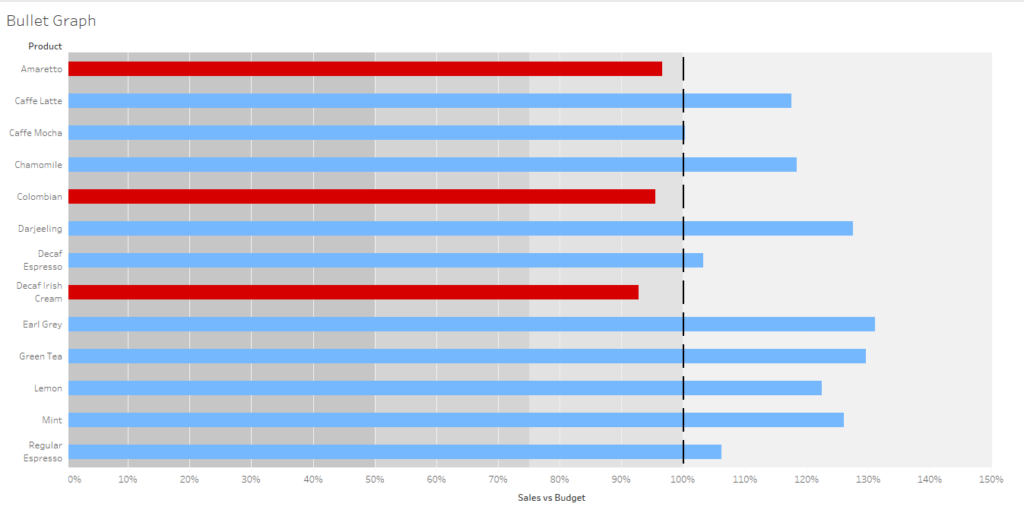
- Right click on any of the background the in the chart and click format. Go to your borders section and expand your row divider with the level lever. This will help us to split up the graph.
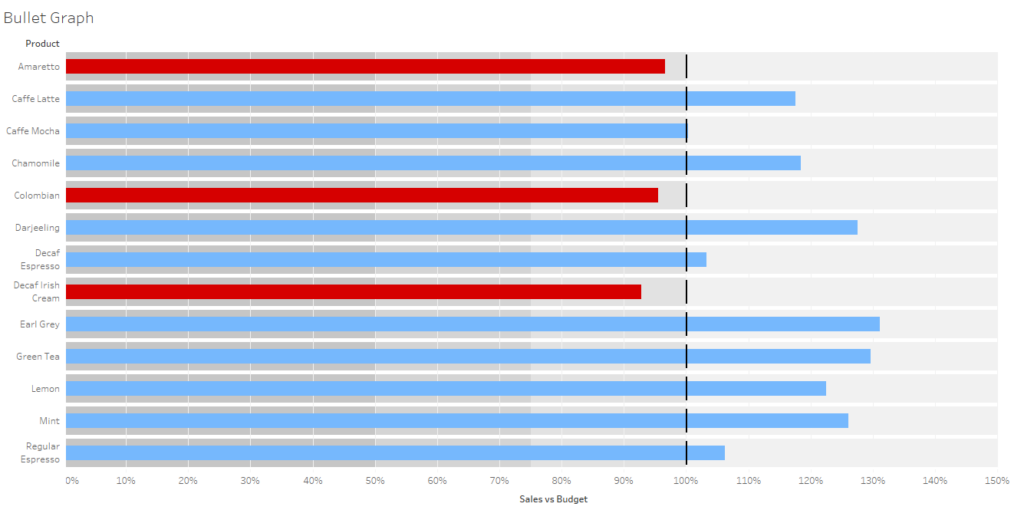
Lastly, one bonus tip. Let’s try and get the red dot next to the header to ‘flag’ up underperforming measures, as we saw in Andy’s example.
- Duplicate product in your data pane and bring on the copy onto the rows shelf.
- Create a new calculated field so we can work out if the product is profitable or not.

I used an asterisk as the flag but use anything.’ Windows ; ‘ is a great keyboard shortcut to find unique characters on windows machines.
- You can now bring this calculated field onto the rows shelf and it should flag your measures which are underperforming. Shuffle your pills along until the ‘flag’ is on the left hand side.
And we’re done!
