Week 4 saw the team looking at its first set of client data and using Alteryx and Tableau to gleam some useful and actionable insights. A brief from the client talked us through the data and we discussed and recorded areas they wished us to investigate. Post brief, we mapped out a timeline for the group – working in pairs – to go about the week’s project.
Following this, we then went straight into an Alteryx Predictive Analytics class. Getting to grips with some of Alteryx’s forecasting tools would come in very useful for our client project. Alteryx has a wide range of easy-to-use predictive tools which allows the user to quantitatively assess the relationship between various variables in the data.
After the workshop Ravi and I set about doing some predictive analysis, Initially, Ravi using Alteryx and myself using Tableau. The nature of the data was that there was too weak a correlation between the particular variables to produce any predictions with any meaning. Tackling the problem from a different angle, I started to produce some overlapping timelines of the data to track any changes over time.
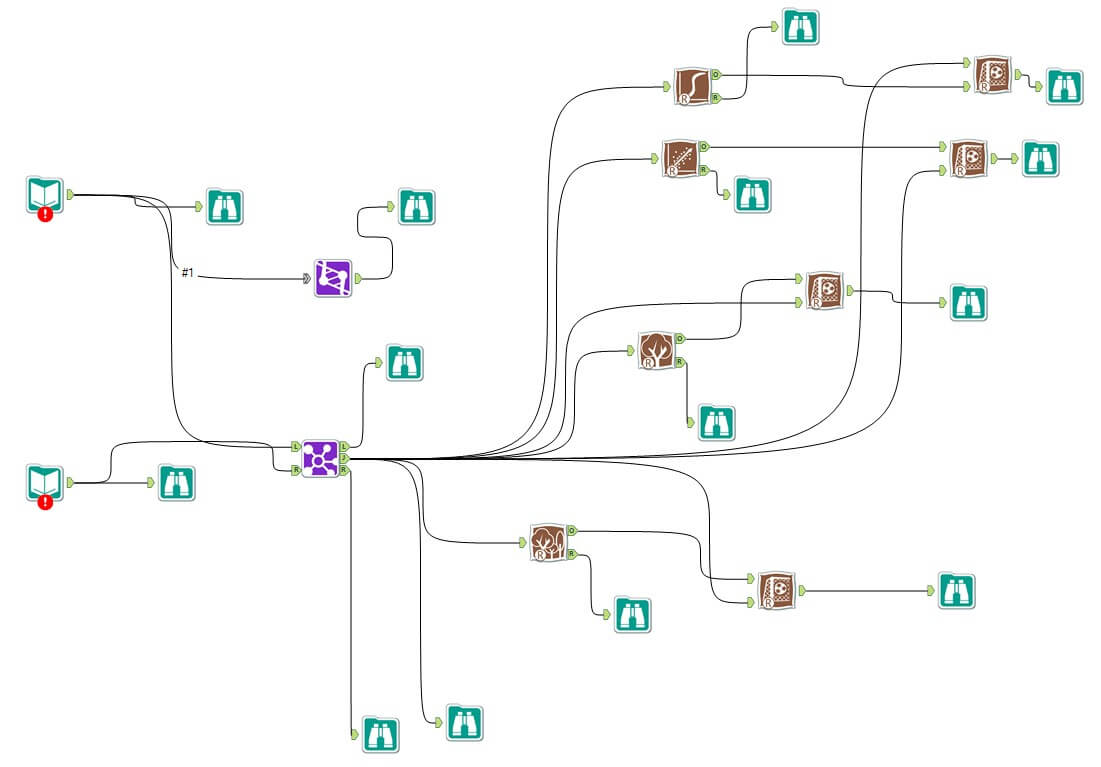
Initial Draft Alteryx workflow showing different predictive tools (in brown).
Presenting
In the space of a week and after only a few weeks training, it was amazing to bring our discoveries together and present some useful findings to the client. A simple example being a timeline of traffic. The chart produced in Tableau took about 4 clicks and yet produced something that invited further analysis by the client.
It was amazing to see even with a relatively straightforward dataset, the useful insights we could produce. We were able to produce some useful interactive dashboards which provided effective customizable overviews whilst also allowing the user the desired drill down capability.
Week 5: Spatial Analytics.
In week 5 we took on something completely different; looking at how alteryx and tableau incorporate location into the analytical landscape. Data containing latitudes (lat) and longitudinal (long) points can be mapped in tableau in as little as 3 easy clicks. Alteryx has a whole section of tools dedicated to spatial analytics. The create points feature identifies the x and y positions converting these into lat – longs.
In short it is incredibly powerful and I suspect infinitely simpler to apply than in other generic BI apps.
One feature in particular I found to be particularly cool was after downloading some UK government transport data for London. The geographic data was held in northings and eastings rather than latitude and longitudes. Not particularly familiar with northings and eastings and with a keenness for equations, I set about finding out how to translate these. Turns out it’s a pretty tricky mapping function as of course you are imposing spherical co-ordinates onto a two dimensional space. After about 10mins looking around, I thought I’d ask if there was a way alteryx could do it itself, Chris showed me, it took 10 seconds!
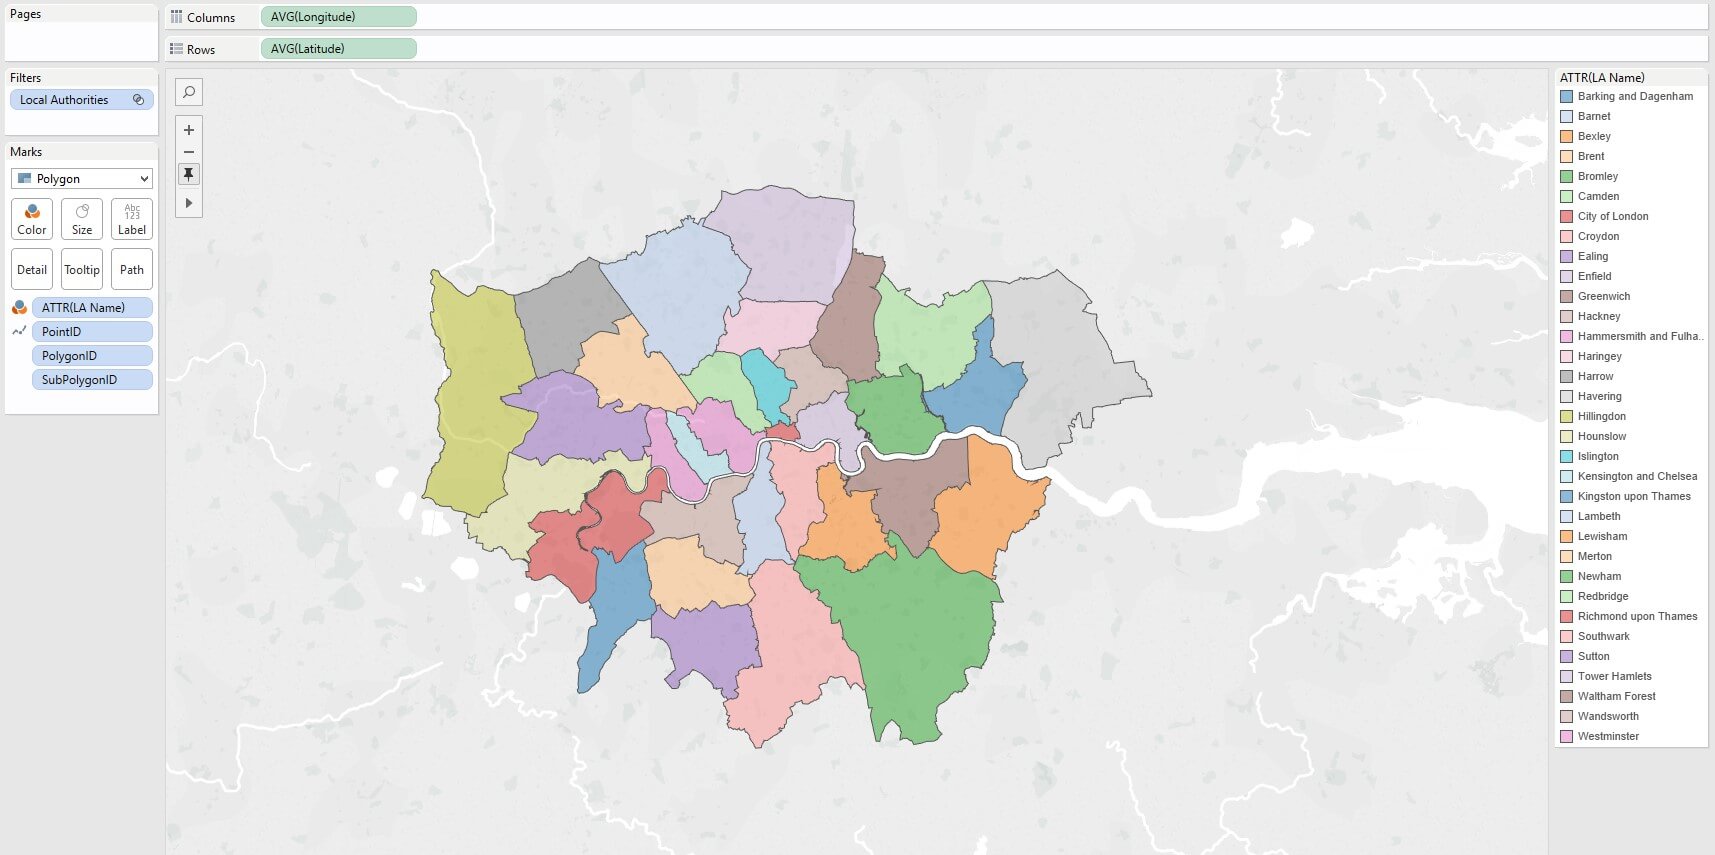
We also did mapping polygons onto Tableau, this is great for defining areas and filling them in. Below are the Local Authorities in London – a good example of putting polygons into action. Here the Point ID dimension is put on path to map out the borders of the different local authorities. Once the boundaries are mapped, the data polygon IDs (which have their own lat, long points) can be mapped into the respective areas.