


The Data School has got off to an incredible start and it has been fantastic how much has already happened in the first few weeks! We have been lucky enough to meet a range of some of the most influential people in our industry, attend the Tableau on Tour conference in London and engage in a number of workshops led by the Information Labs Consultants. A relentless learning path has been supported by a diverse range of very helpful resources but far more importantly, the constant availability and friendly help of the Info Lab’s consultants.
A weekly project is concluded at the end of each week with a short presentation and a beer! Presentations so far have included an old Viz makeover, an Alteryx workflow and tableau Viz and a ‘tips and tricks’ learnt from the data 15 conference.
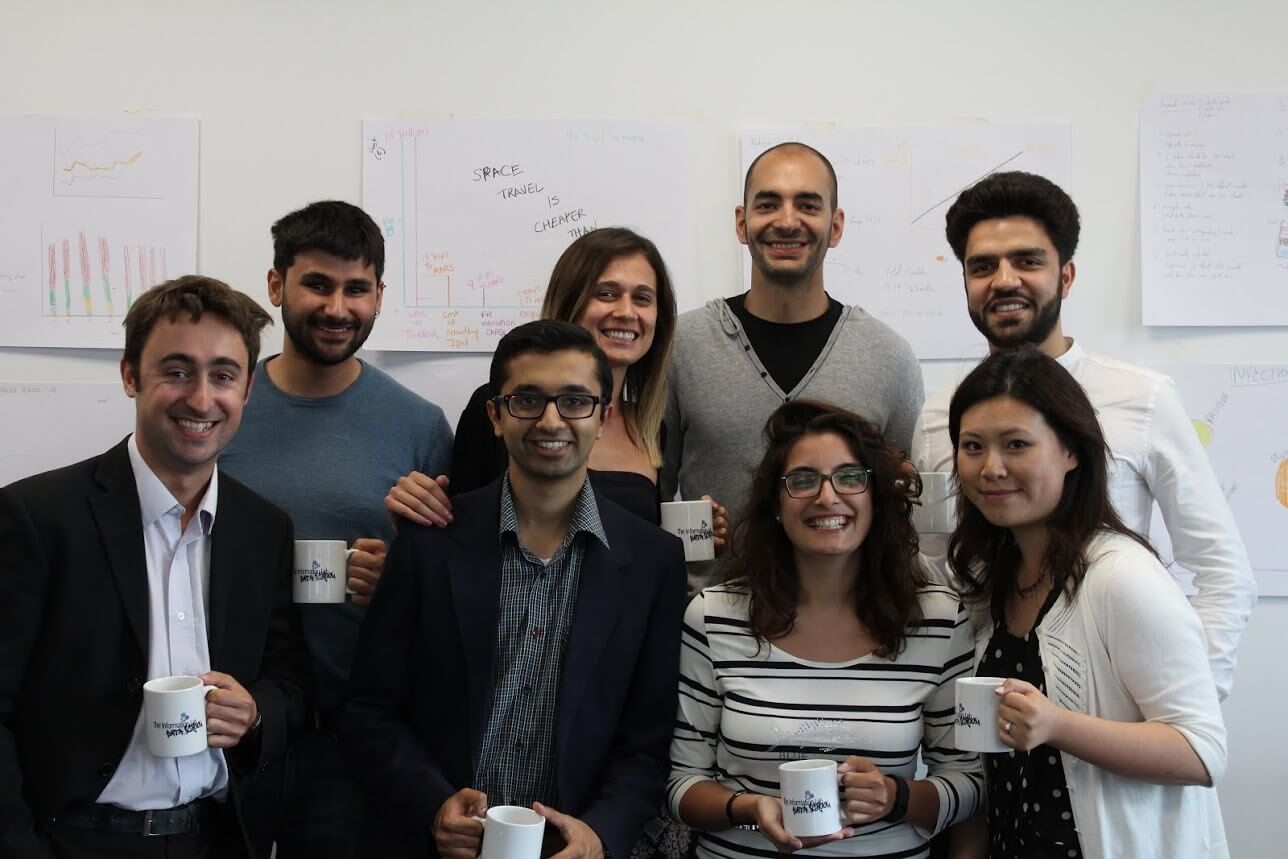
The first intake at the Data School.
The Data School has created a powerful environment for learning with brilliant resources and a supportive and fun culture. This was very quickly picked up by the students and it has been great witnessing seeing everyone digging in to help everyone else. The first batch of students is wonderfully diverse with a broad range of skillsets and each with a strong desire to further develop their data capabilities. Tableau is a perfect tool for making full use of this broad range of skills and interests and it has been great fun seeing how everybody uses Tableau and Alteryx to present their data.
To further supplement all the learning, there are a series of client projects that we will be going through during our time at the Data School. Putting Tableau and Alteryx into action is the best way to learn and it will be very exciting to apply our newly learned skills in a commercial context.
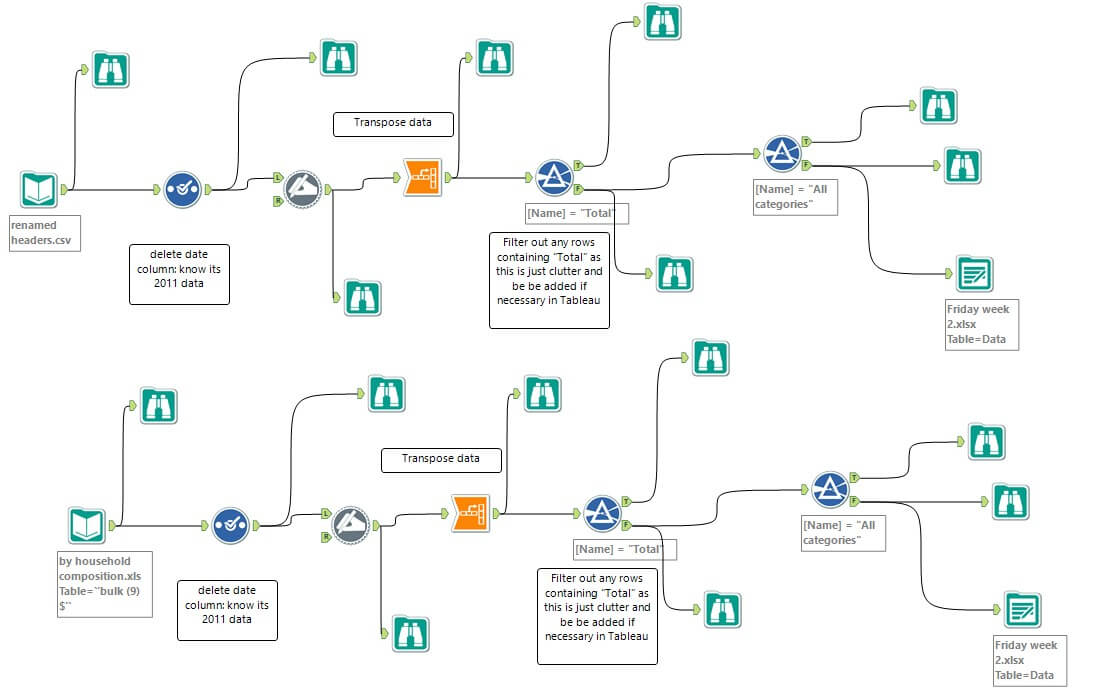
Week 2 Project – Alteryx Workflow
The first two weeks consisted of a number of workshops to bring us up to speed with the basics of Tableau and Alteryx. Although a Zen Master training session on day 2 showed us some of the more advanced capabilities of Tableau. While this may have been a tad over our heads – it did show us what was possible. Returning to the material a few weeks later, we started to make more sense of it thankfully!
In the third week we attended the Tableau on Tour Conference in London. This was a great opportunity to see first-hand how Tableau helps its customers optimize their use of data. It was also a chance to meet in person the Tableau community and put a face to the online contacts we meet.
Tableau on Tour – “connecting with data and people”. The conference brought together people from a wide range of companies all with a desire to further develop their use of data. Whether this is a Health Service provider delivering interactive web based platforms for patients and managers or a low cost airline analyzing flight paths. What quickly became apparent is the sheer range of application potential tableau possesses. The calibre and diversity of guest speakers was also highly impressive. As data becomes the new currency of the digital economy, it is clear just how massive this market is going to become.
In short it has been an amazing few weeks. I defy any other graduate scheme to provide this much opportunity, resource and friendly support over their respective program.