Continuing this week’s Data School daily Tableau Tips and Tricks, today I’m going to briefly blog about the Replace Data function in Tableau. Recently the Data School all gave presentations on a particular area of Tableau. Mine was on Data Connections. This area covers quite a bit and so I tried to concentrate mainly on finding out about some of the features we probably had not used much so far or possibly even at all.
While talking about Data Extracts I stumbled upon the Replace Data Source function. This allows the user to create content with one data source and then maintain the same visualization build but with a different data source. This feature is particularly useful when dealing with data extracts, where we may be periodically updating our data source. Perhaps we are dealing with a very large dataset or maybe we are doing a proof of concept and are just using some dummy data to check we are happy with the visualization before importing real data.
To show this feature I have used two simple datasets with one showing athlete’s data at the Olympics and the same which just contains USA athletes. Let us say I wanted to start off by building a chart using the USA data. I could build my visualization, then bring in the larger sheet and replace the data source. We need to make sure that Tableau understands which variables we are replacing what i.e. country field would obviously replace country field but they have to have exactly the same name ie not “country name”. We can rename fields to tell Tableau this if our replacement data has not already got the same matching column headers otherwise we get a warning from Tableau. Even then, by clicking on edit reference, we can tell Tableau what variable is meant to replace. The beauty of it of course is in its simplicity.
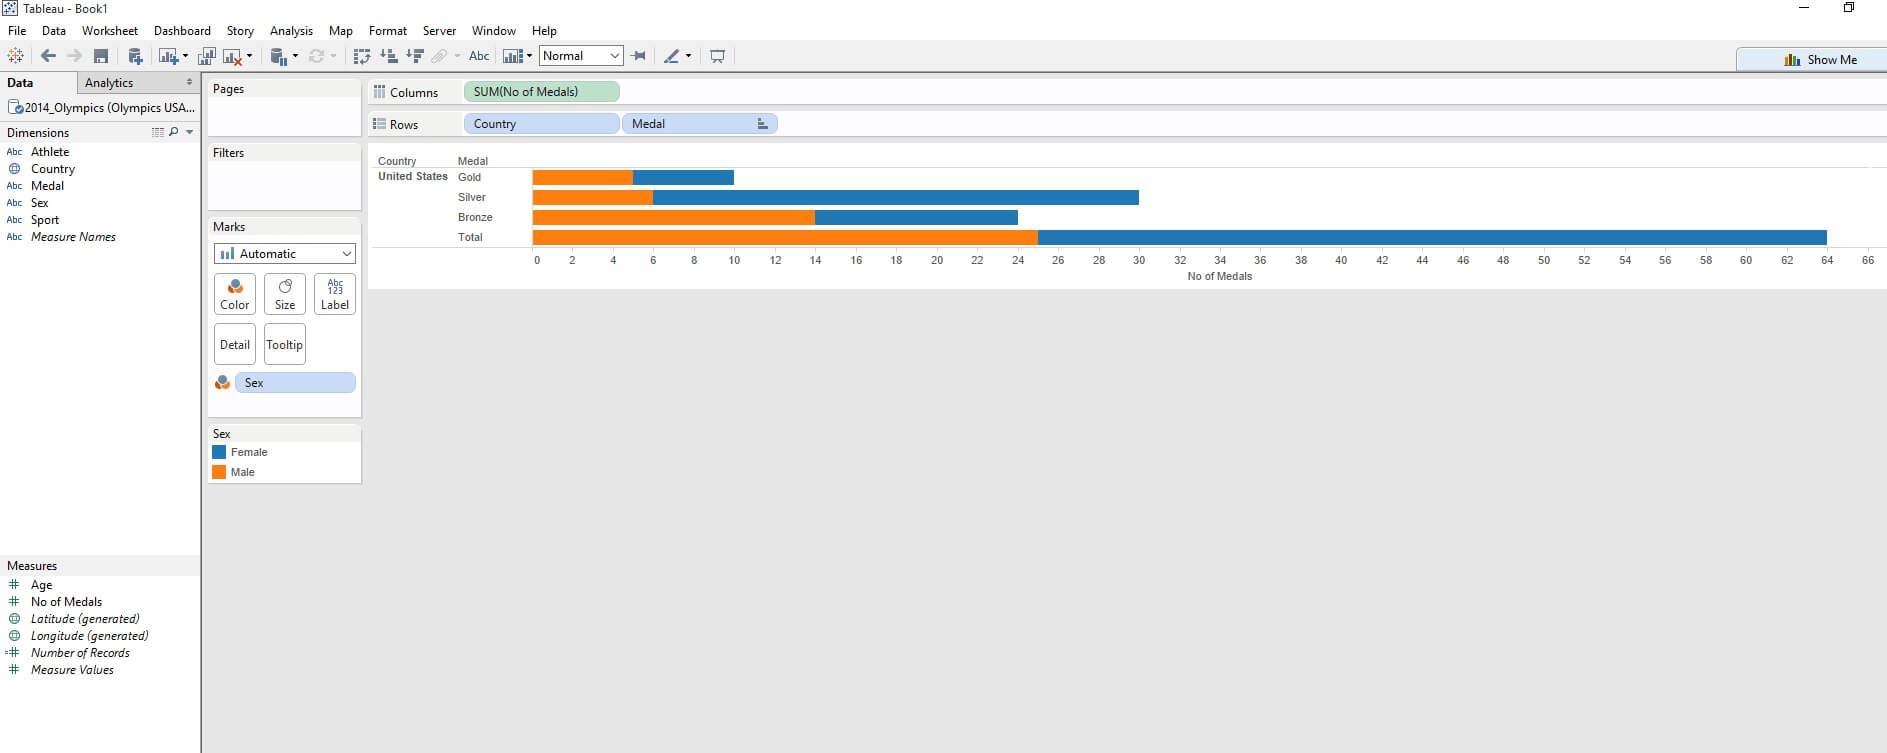
I have built my vastly complicated bar chart showing USA medal winners and colored by gender. I then add a new data source (Ctl + D) and bring in my excel sheet. In this case a second excel list of Olympic medals but with additional countries.
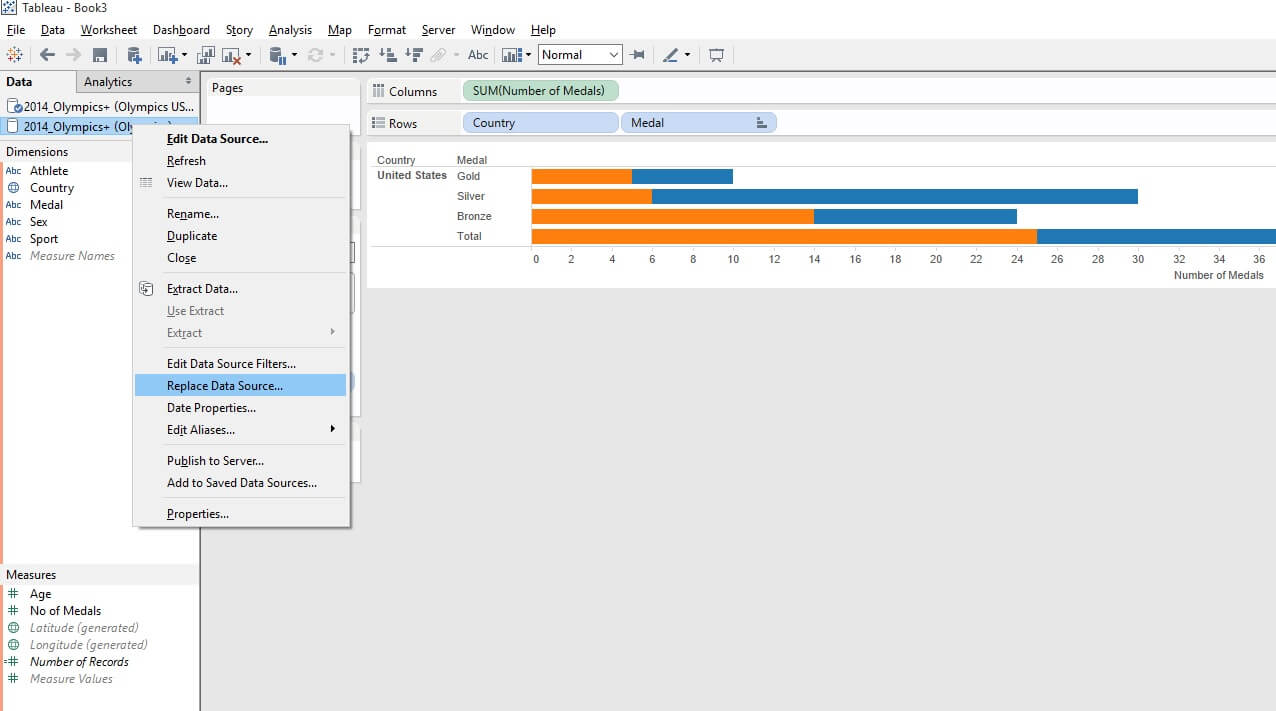
Clicking on the secondary data source, we should see an orange line down the list of dimensions and measures as tableau is looking to blend them. We should also see the chain to the right of the variable showing where Tableau things we can blend the data based on similar variables. Of course we don’t want to blend in this case but replace the data source.
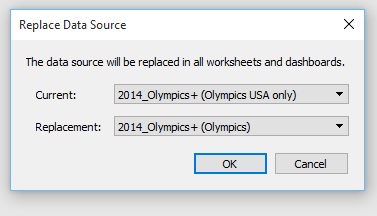
Right clicking on the secondary data source (the one without the blue tick) and clicking on Replace data source we can see what the current source and what we want the replacement source to be. Of course I only have two data sources so this is obvious but if I had 3 or more data sources open, I could just click on the little arrow to the right of the replacement dropdown and select the appropriate data source.
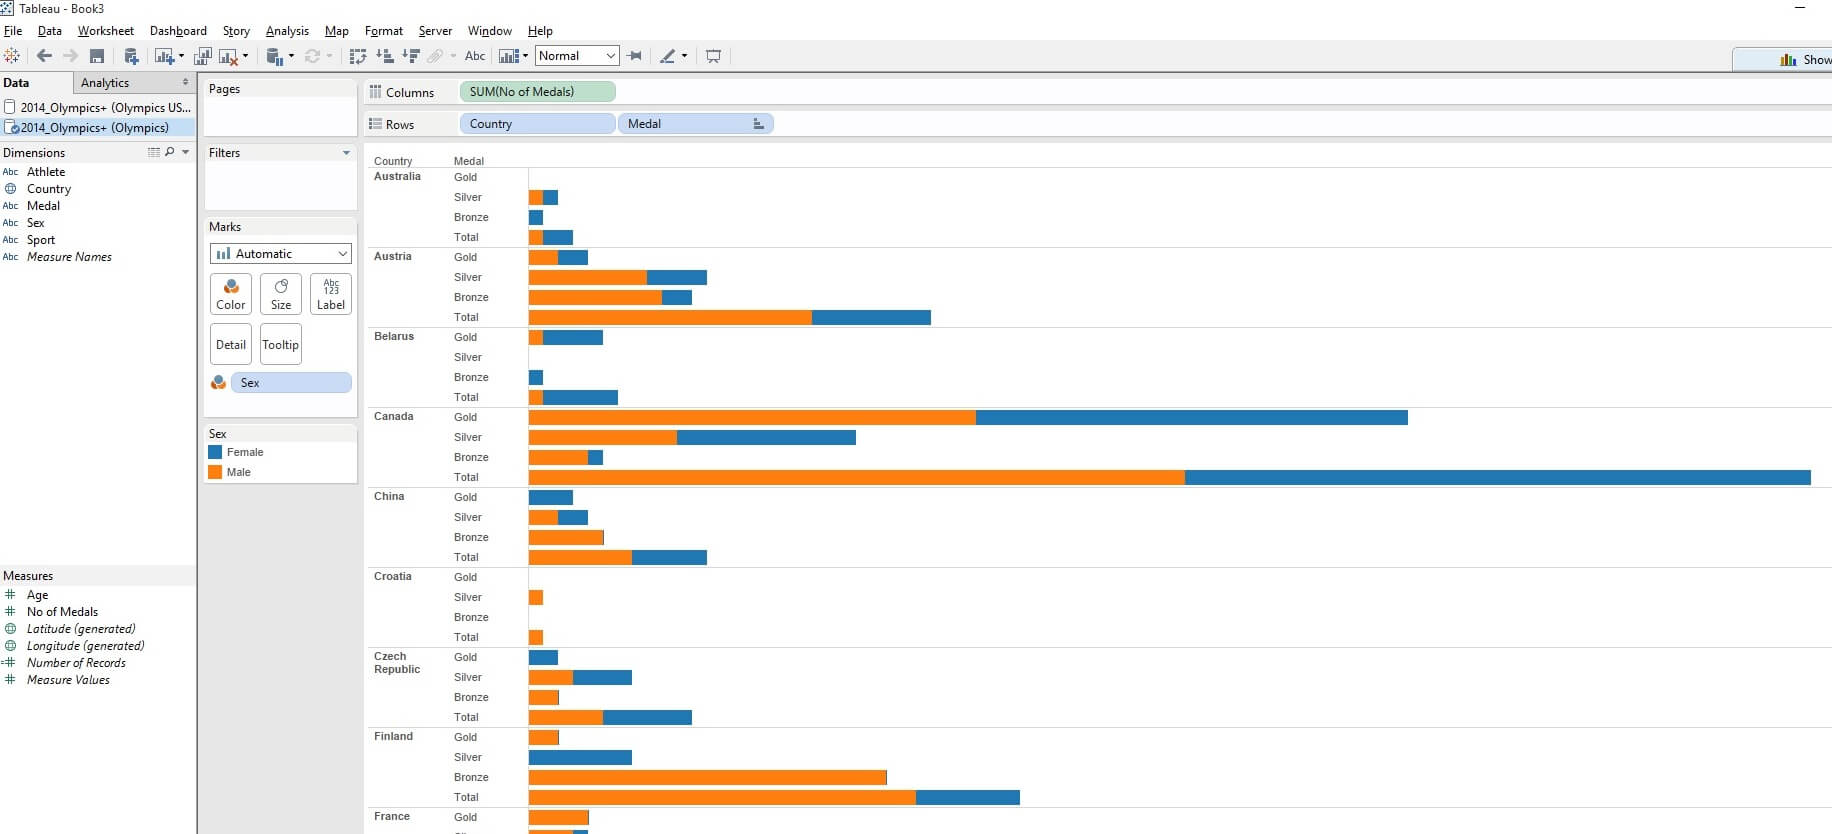
Clicking ok, we now get:
And hey we have kept the same viz layout but with a different data source. The same layout and any table calcs etc would be applied to the new data source.


