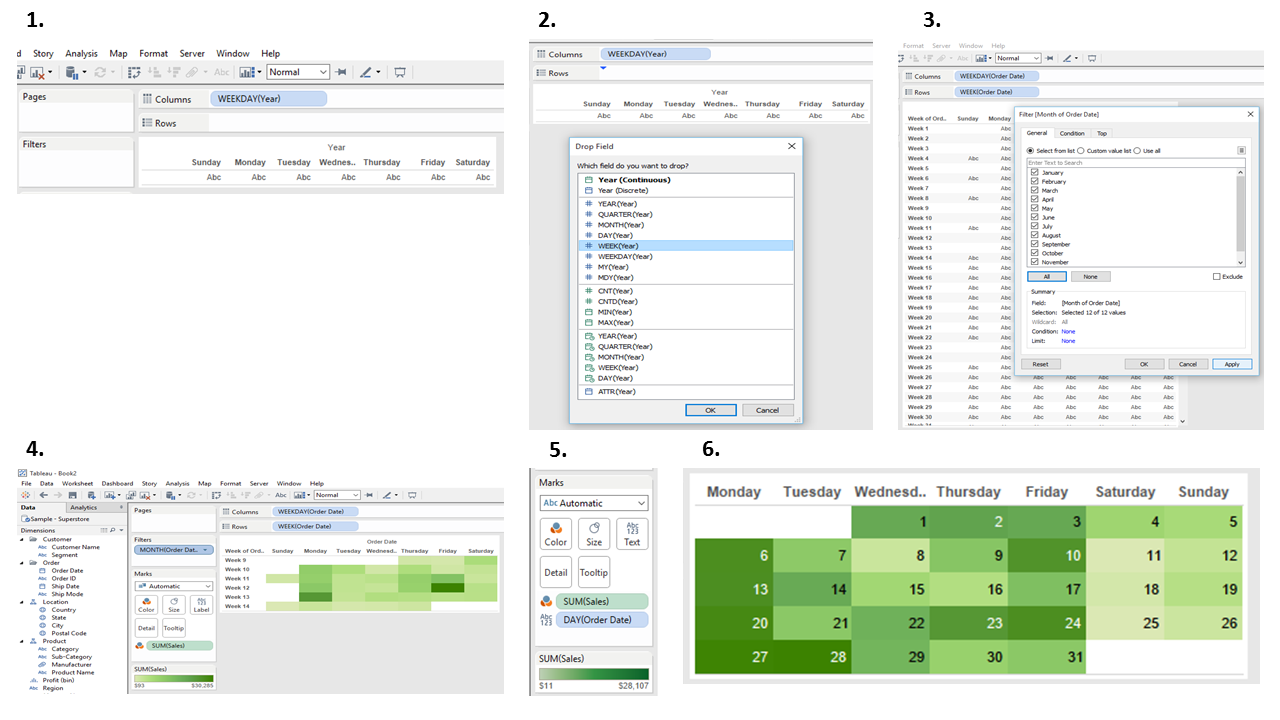
The last of my tips is finally here! So I have been building a calendar view in Tableau ever since I first downloaded my free trial. As it has been really effective with already two clients (out of three), I recommend you to try this at home and quickly gain the ability to visualize cyclical time events. Please follow the following steps:
- Drag a ‘weekday’ date dimension onto columns
- Drag the same dimension as ‘week’ onto rows
- Filter by ‘month/year’
- Drag measure onto color in the Marks card
- Label by ‘day’
- Result!
Happy Friday!