


Welcome to Data School’s very own “Tips and Tricks Week”. Each one of us will be posting daily entries about things we have learnt in Tableau Desktop or Tableau Server, and passing the knowledge onto you. My desire to make data accessible to everyone without being necessarily data literate lead me to create a word cloud in Tableau. In a few simple steps you can create this beautiful visual representation of text data where bigger words have heavier weighting than small ones.
Since the Conservative Party has recently won the elections for Parliament, I fancied to investigate if they had started to implement pledges, such as investing an extra £8bn in the NHS. What is the current government’s public expenditure?
Without further ado, here is my tip:
- Connect to your datasource Here I have downloaded the latest dataset of government spending for the month of August published by the Economic and Social Research Council.
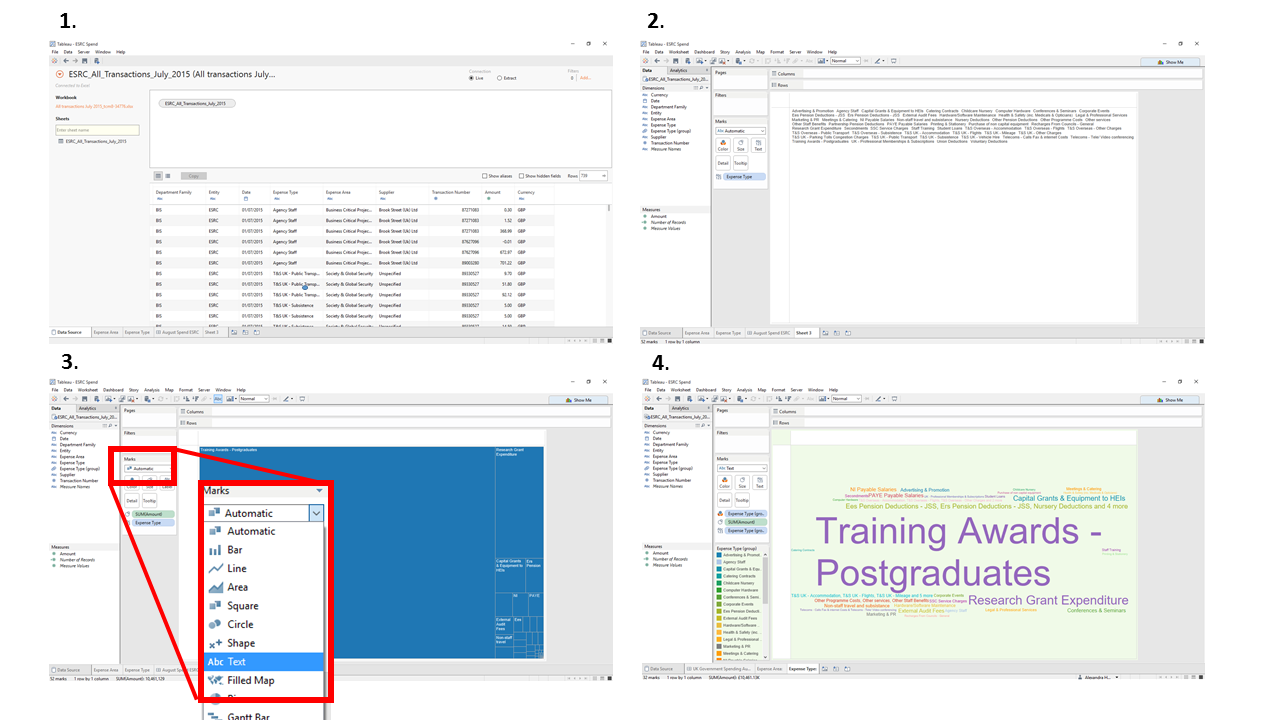
- Drag the string dimension with the words you want include in your viz onto Label or Text on the Marks card.
- Drag a measure onto size. Tableau will automatically change the Mark type into “square” resulting in a Treemap viz. This should be reverted back to “text” by selecting it from the drop down menu.
- Drag another dimension onto Color.
You can find and recreate my viz here! I am glad to say that this month’s government spending was directed to celebrate students successes with Training Awards for Postgraduates. I challenge you to keep track of public spending and see how this trend changes over time.
How to create a word cloud in Tableau