Today we were looking at requests received by Google, regarding removing content due to copyright. We got the data from the Google Transparency Report (https://transparencyreport.google.com/copyright/overview?browse_copyright=ce:org;size:6&lu=browse_copyright). The data contained rows of over 8 billion requests, a substantial task for any computer to handle. As such, I decided to focus my analysis on the film and television industry. I choose 4 companies from the industry that had high numbers of requests for URL removals – these were Paramount, NBC Universal, Fox, and Home Box Office. I was intrigued to see any changes in the numbers of requests in the past few years, as my impression was that the number of blogs reviewing and discussing the film and television series had increased drastically in the past 5 years.
After downloading the data I filtered it to just look at requests that had one of my 4 companies as the copyright owner (the company that have the copyright complaint). This can be seen in my Alteryx workflow, below.
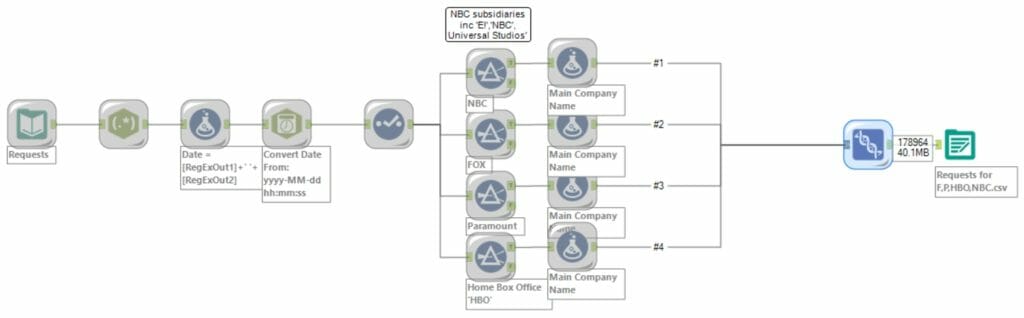
I then loaded this altered dataset into Tableau to begin my exploration.
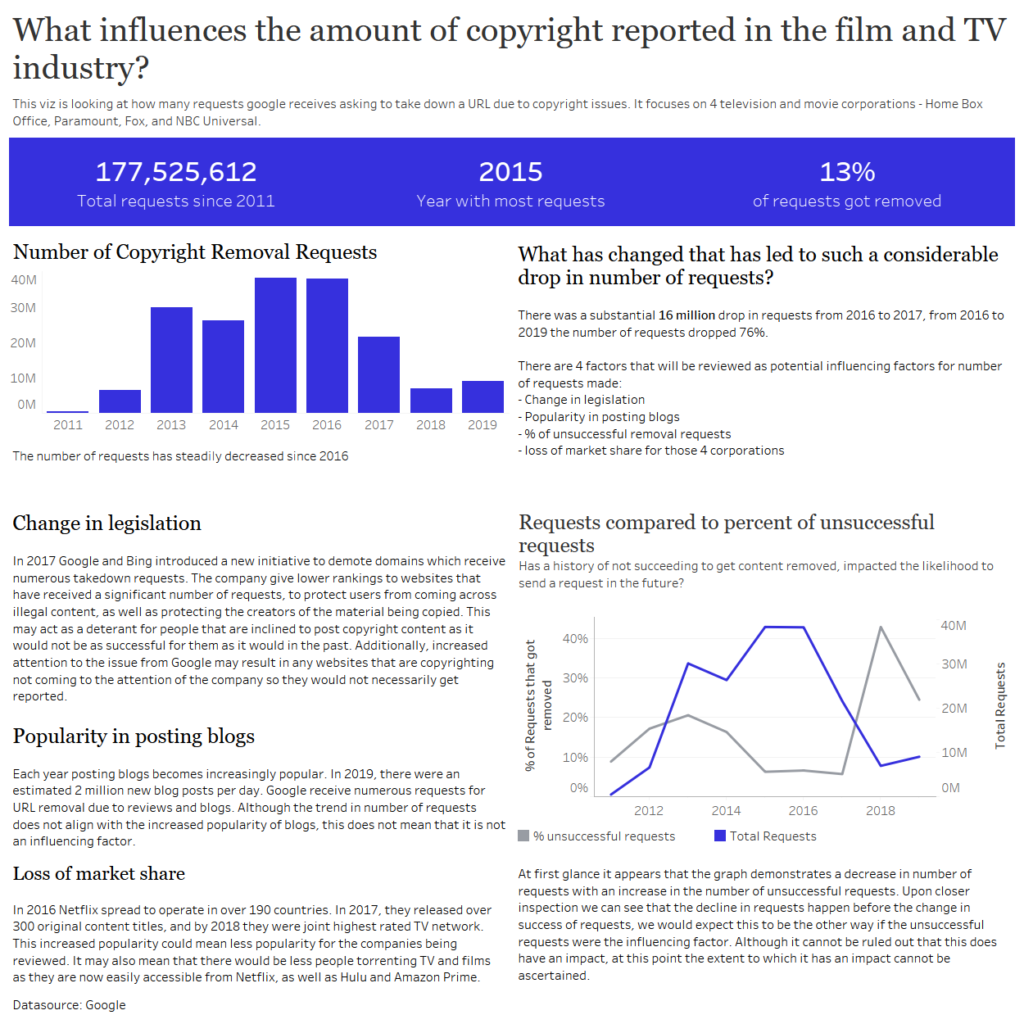
When I started this project I thought that the number of requests would increase annually, due to the increasing number of bloggers on the internet and high numbers of them doing reviews and discussions on film and TV. The result was not as I had expected, which led to the focus of my analysis – trying to ascertain what influencing factors there are on the number of requests from the industry.
There were 4 factors that I explored: changes to legislation, popularity in posting blogs, correlation between % of unsuccessful removal requests and how many requests the company makes in the future, and whether it could be due those 4 corporations losing market share due to new contenders such as Netflix.
The blog and findings can be found by clicking the image below to view the full viz.