Today we were tasked with using an old version of Tableau (8.3), from 2015. While it’s still a great, useful piece of software, it does make you appreciate all the developments that they have made in the past few years.
We were looking at data on Student Registers For Universities in California, from the University of California ClioMetric History Project between 1893 – 1945.
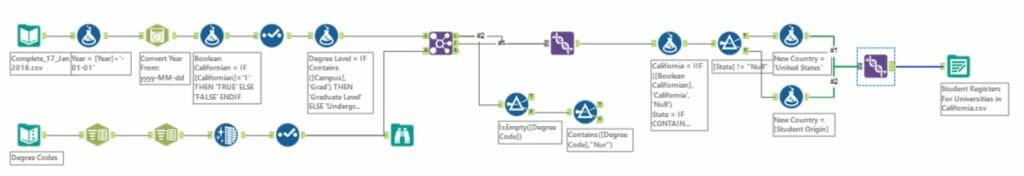
The data was in good condition apart from the fact that there was 1 column for the location origin of the student, with varying levels of detail in it. If they were from California – the city they were from was what was listed, if they were from elsewhere in the US – it was the state they were from that was listed, otherwise it was their country of origin. There was no indication elsewhere in the data if that students location was a city, state or country level, so splitting it out to analyse proved a challenge. I did this on Alteryx (workflow below).
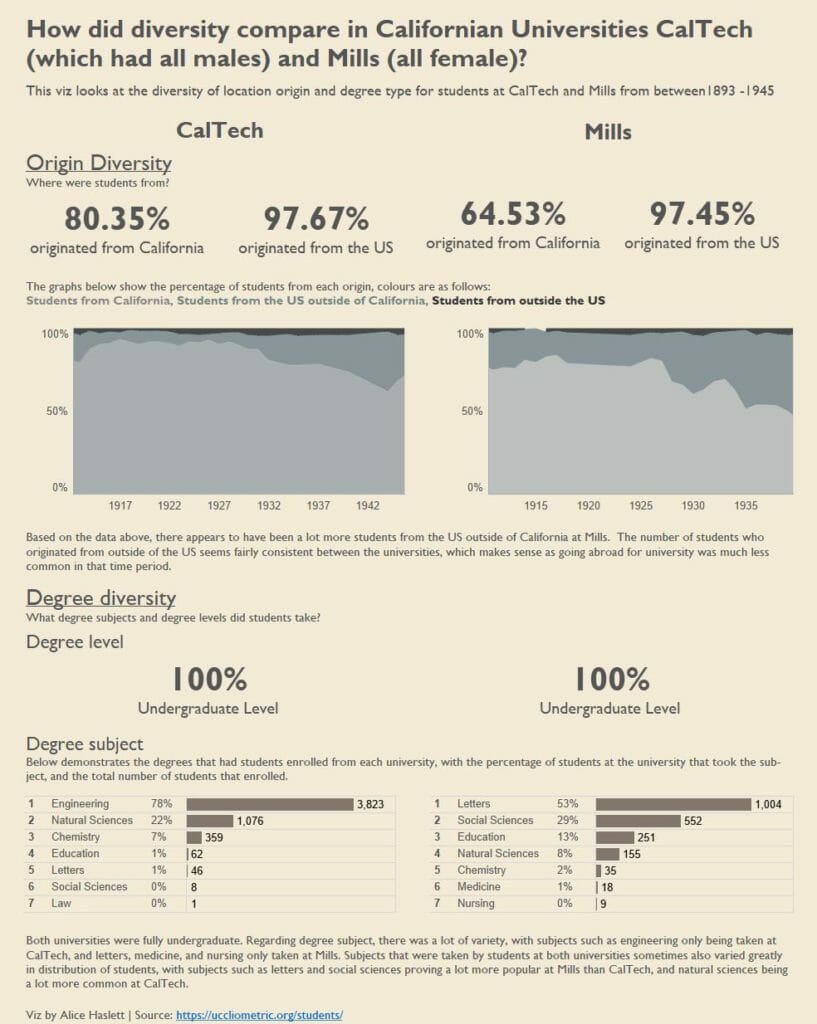
After exploring the data I noticed that one of the universities (Mills) was an all female establishment, and that CalTech had 100% male attendees. I thought it would be interesting to see the different degrees that students at each university were undertaking, to see what the subjects were and how they differed. From this I decided that it would be interesting to see the diversity of degree level and origin of students as well.
For the full findings and analysis on the viz click the dashboard image below.