


Data Visualisation for non-noobs: Improving the Hierarchy PART TWO: The Double Drill Javascript API
As I mentioned in my previous blog, I wanted to extend my previous post, which showed you how to use a Javascript API to dynamically drill down into single parts of the hierarchy, without having to expand you whole visualisation (http://wp.me/p6XID2-1qP). In this post, I have finally found out how to do two consecutive drill downs, for example from region to country and then country to state. After searching high and low for the answer and getting in touch with the whole of twitter, I finally got the help I needed from Jeffrey Shaffer, who managed to make the code work!
The solution is essentially quite simply, you just need to include two parameters in your code, my problem was that I am no coding expert. Here is how to go about doing the double drill, using the example of superstore sales again, drilling into sales from region to country and from country into state.
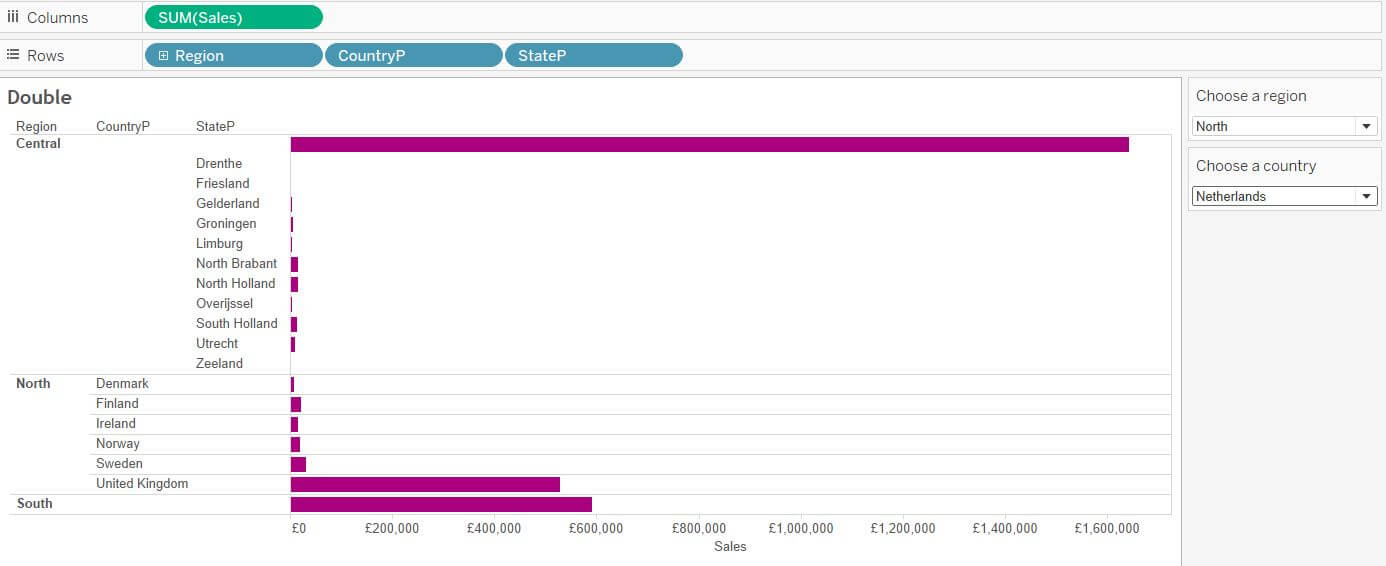
STEP 1: Set up a viz with two parameters, one for the countries and one for the state, as shown below:
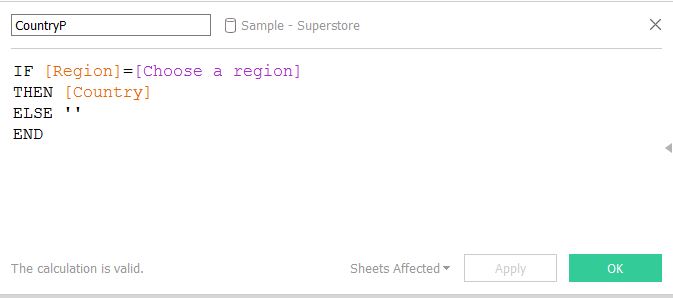
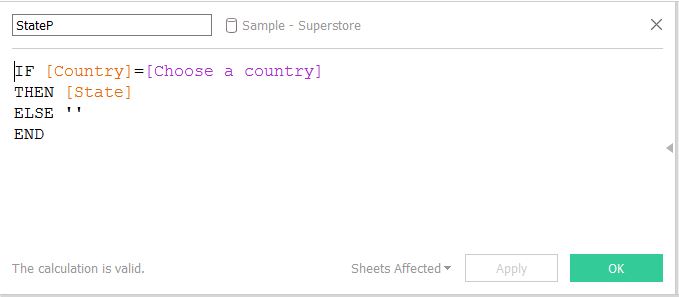
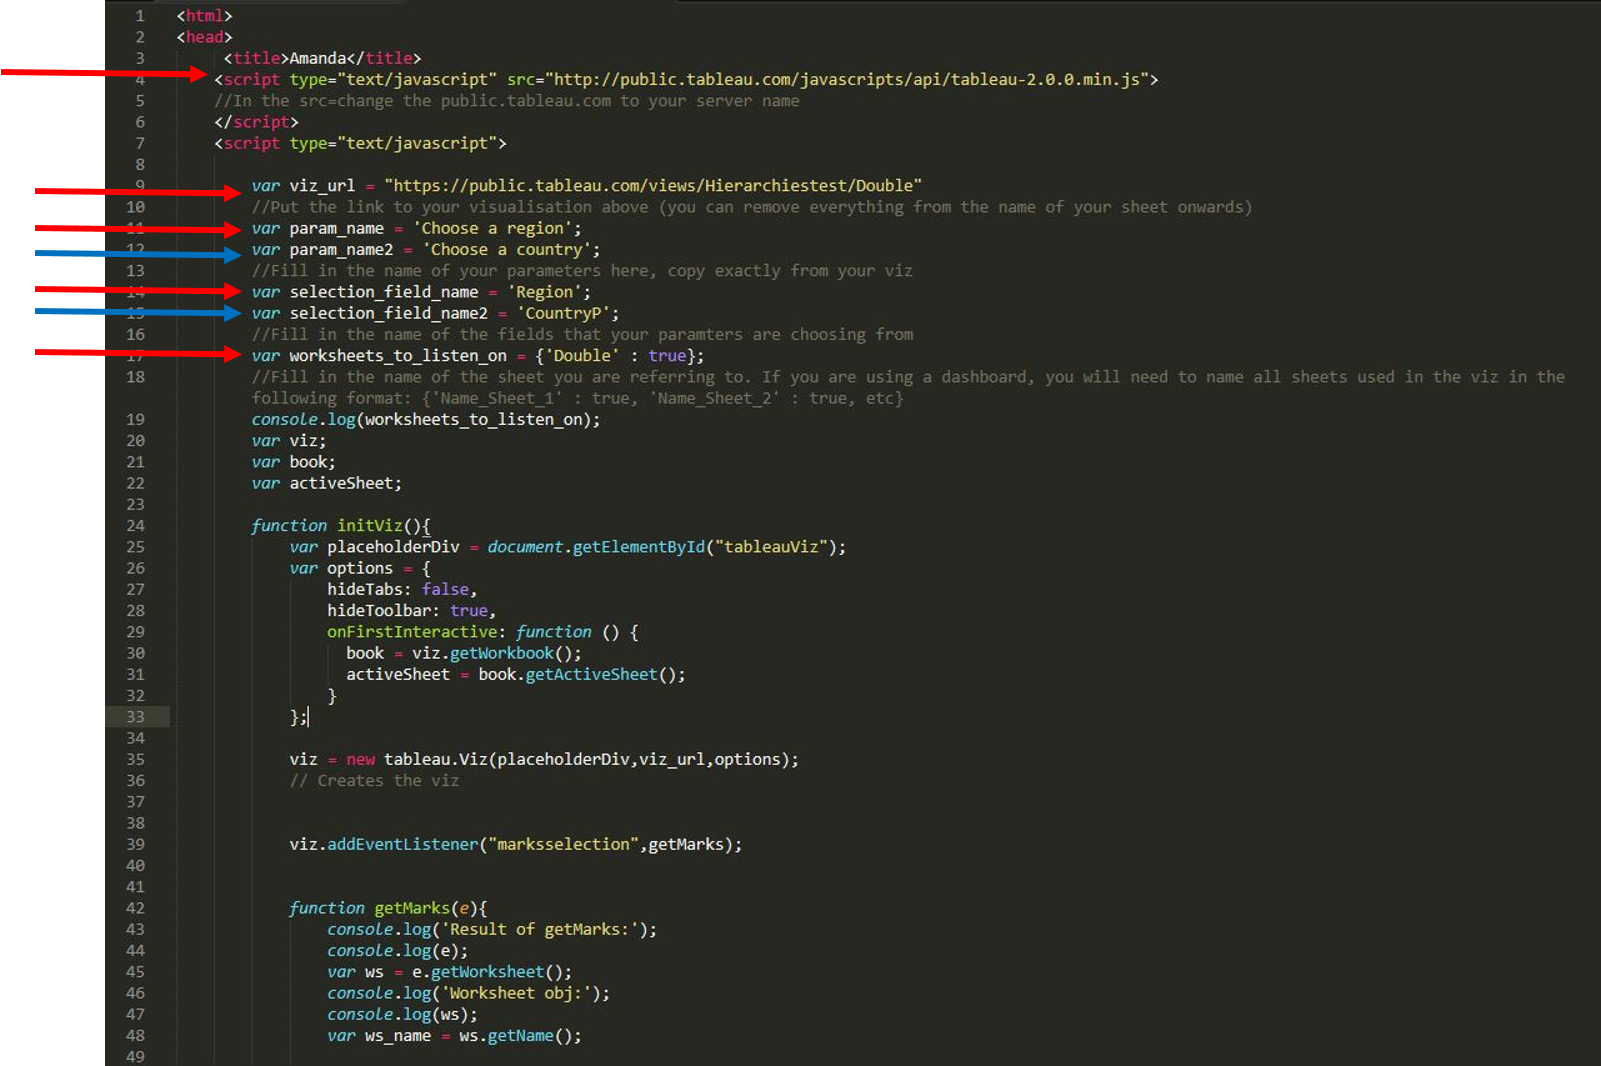
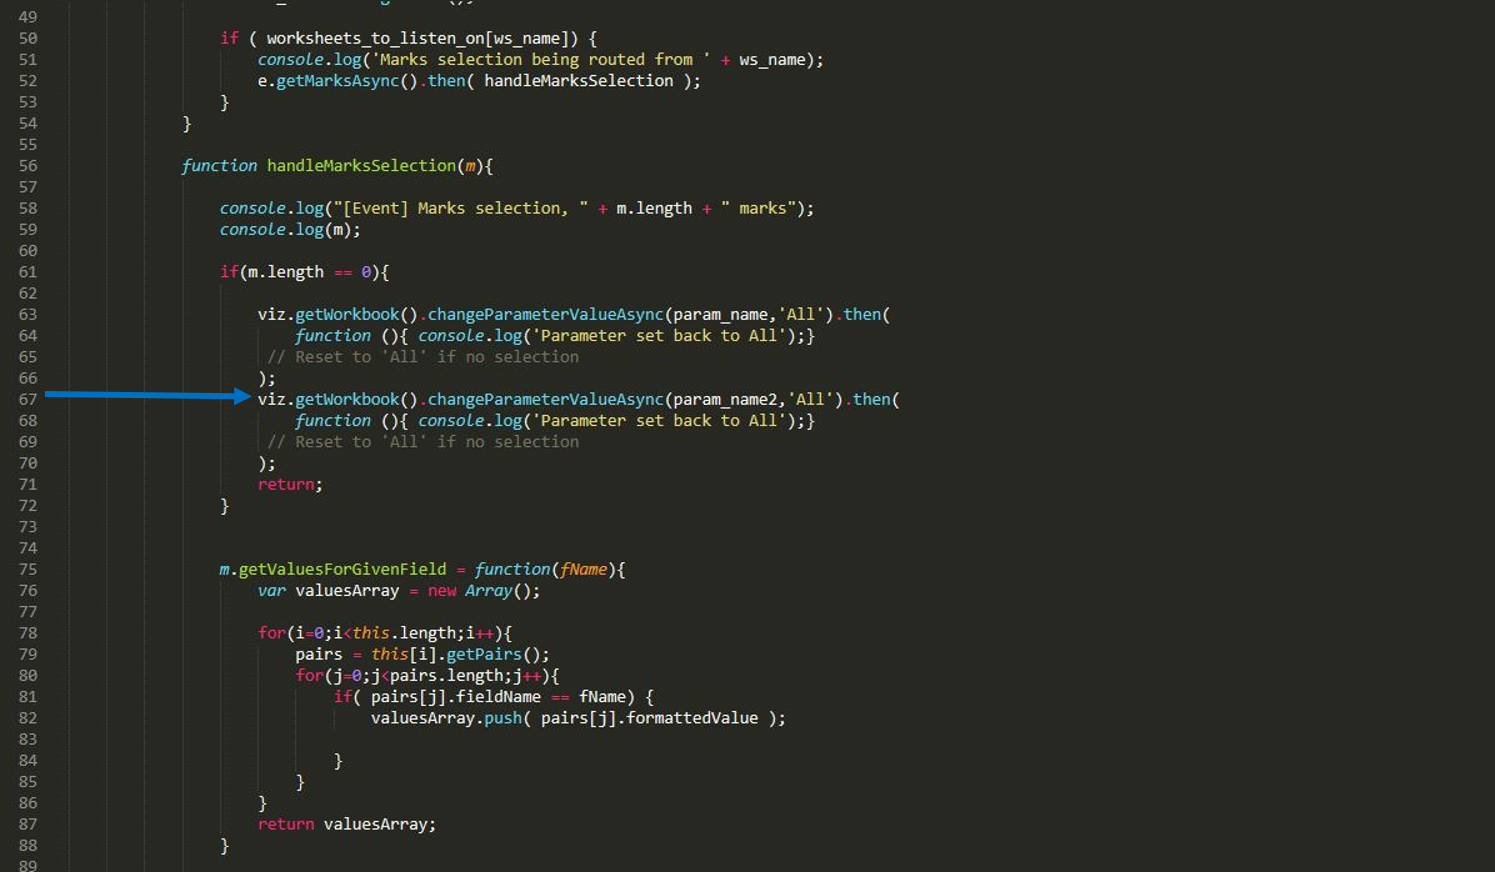
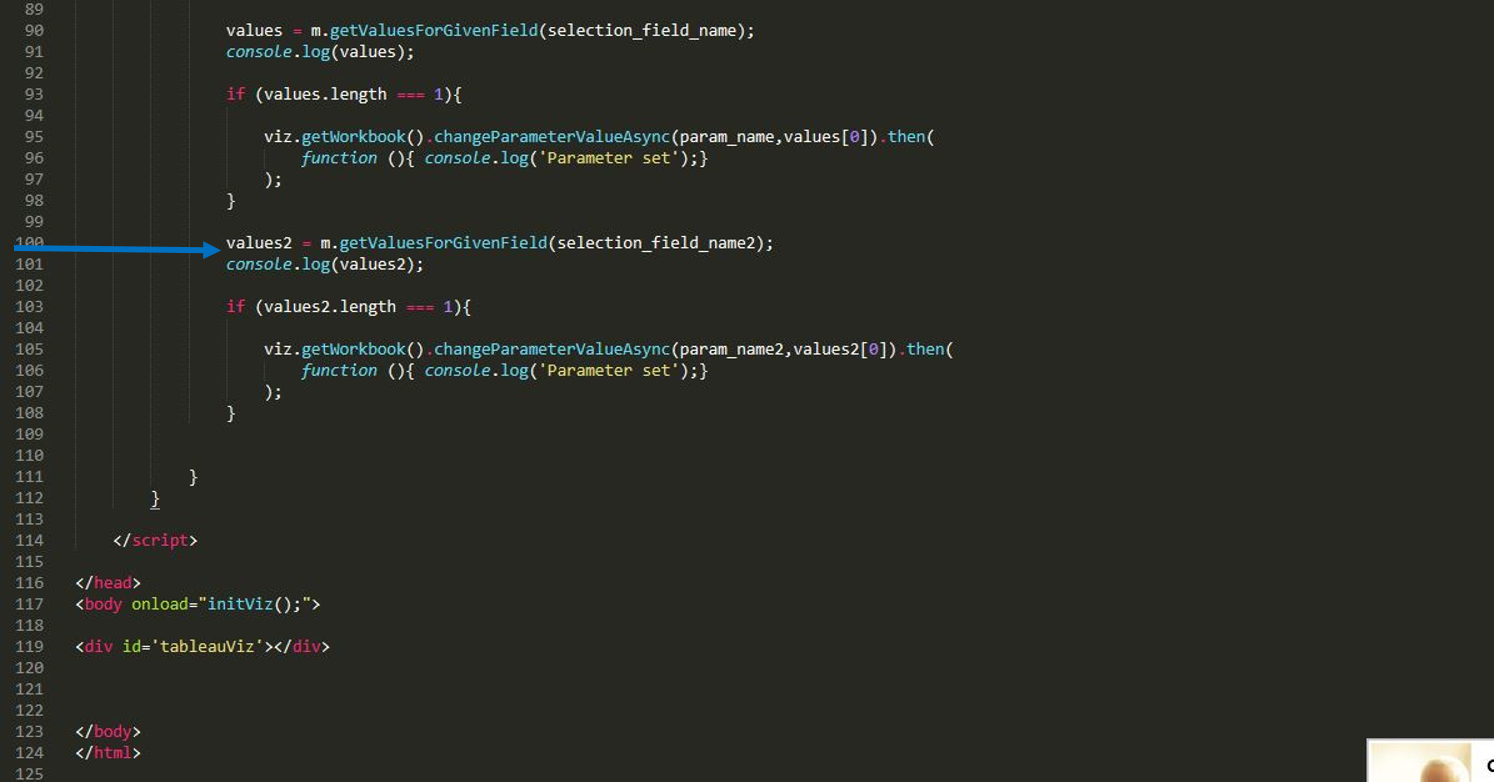
STEP 2: Build the API, for more information on this, please see the previous post (http://wp.me/p6XID2-1qP). The code in full is at the bottom of the page. The changes you need to make, are highlighted with red arrows and are annotated on the code text/image. Where this differs from the original code, is highlighted in blue arrows, this just highlights where the code needed to be repeated to achieve the double hierarchy.
What I still haven’t managed to do, is figure out how to sequentially drill back up, so if anyone has any ideas, I’d love some feedback!
————————————————————————-
The code (copy and paste this into sublime and save it as an HTML file, so you can see the sample viz, or to make your changes):
<html>
<head>
<title>Amanda</title>
<script type=”text/javascript” src=”http://public.tableau.com/javascripts/api/tableau-2.0.0.min.js”>
//In the src=change the public.tableau.com to your server name
</script>
<script type=”text/javascript”>
var viz_url = “https://public.tableau.com/views/Hierarchiestest/Double”
//Put the link to your visualisation above (you can remove everything from the name of your sheet onwards)
var param_name = ‘Choose a region’;
var param_name2 = ‘Choose a country’;
//Fill in the name of your parameters here, copy exactly from your viz
var selection_field_name = ‘Region’;
var selection_field_name2 = ‘CountryP’;
//Fill in the name of the fields that your paramters are choosing from
var worksheets_to_listen_on = {‘Double’ : true};
//Fill in the name of the sheet you are referring to. If you are using a dashboard, you will need to name all sheets used in the viz in the following format: {‘Name_Sheet_1’ : true, ‘Name_Sheet_2’ : true, etc}
console.log(worksheets_to_listen_on);
var viz;
var book;
var activeSheet;
function initViz(){
var placeholderDiv = document.getElementById(“tableauViz”);
var options = {
hideTabs: false,
hideToolbar: true,
onFirstInteractive: function () {
book = viz.getWorkbook();
activeSheet = book.getActiveSheet();
}
};
viz = new tableau.Viz(placeholderDiv,viz_url,options);
// Creates the viz
viz.addEventListener(“marksselection”,getMarks);
function getMarks(e){
console.log(‘Result of getMarks:’);
console.log(e);
var ws = e.getWorksheet();
console.log(‘Worksheet obj:’);
console.log(ws);
var ws_name = ws.getName();
if ( worksheets_to_listen_on[ws_name]) {
console.log(‘Marks selection being routed from ‘ + ws_name);
e.getMarksAsync().then( handleMarksSelection );
}
}
function handleMarksSelection(m){
console.log(“[Event] Marks selection, ” + m.length + ” marks”);
console.log(m);
if(m.length == 0){
viz.getWorkbook().changeParameterValueAsync(param_name,’All’).then(
function (){ console.log(‘Parameter set back to All’);}
// Reset to ‘All’ if no selection
);
viz.getWorkbook().changeParameterValueAsync(param_name2,’All’).then(
function (){ console.log(‘Parameter set back to All’);}
// Reset to ‘All’ if no selection
);
return;
}
m.getValuesForGivenField = function(fName){
var valuesArray = new Array();
for(i=0;i<this.length;i++){
pairs = this[i].getPairs();
for(j=0;j<pairs.length;j++){
if( pairs[j].fieldName == fName) {
valuesArray.push( pairs[j].formattedValue );
}
}
}
return valuesArray;
}
values = m.getValuesForGivenField(selection_field_name);
console.log(values);
if (values.length === 1){
viz.getWorkbook().changeParameterValueAsync(param_name,values[0]).then(
function (){ console.log(‘Parameter set’);}
);
}
values2 = m.getValuesForGivenField(selection_field_name2);
console.log(values2);
if (values2.length === 1){
viz.getWorkbook().changeParameterValueAsync(param_name2,values2[0]).then(
function (){ console.log(‘Parameter set’);}
);
}
}
}
</script>
</head>
<body onload=”initViz();”>
<div id=’tableauViz’></div>
</body>
</html>