


Data Visualisation for Noobs (like me) – A Tableau Based Blog Series
Using an LOD function to plot a national average over an area breakdown
I used my first Level of Detail (LOD) calculation today!
LOD calculations, or expressions, provide a way to compute aggregations that are not necessarily at the level of detail that you have in your visualisation, but can be integrated into your visualisation.
There are three types of LOD calculations ones that include, exclude or those that are fixed at a certain level of detail.
The Tableau website lists the following uses for LOD calculations:
- Cohort analysis – comparing data for different subgroups
- Totals or averages across segments
- Aggregates of aggregates
- Binning aggregates
But these never mean anything to me until I use them myself. And today I got the perfect chance!
Let me set the scene. I was working with some publicly available data on disease prevalence across the UK and wanted to compare the prevalence of certain diseases in a particular area to the national average. To do this, I had to create a calculated field and use a FIXED LOD function, as shown below.

In this case we want to return the prevalence of the ‘disease category’ and the ‘disease name’, fixed without any area or any other type of filtering, so we don’t need to include any other level of detail information.
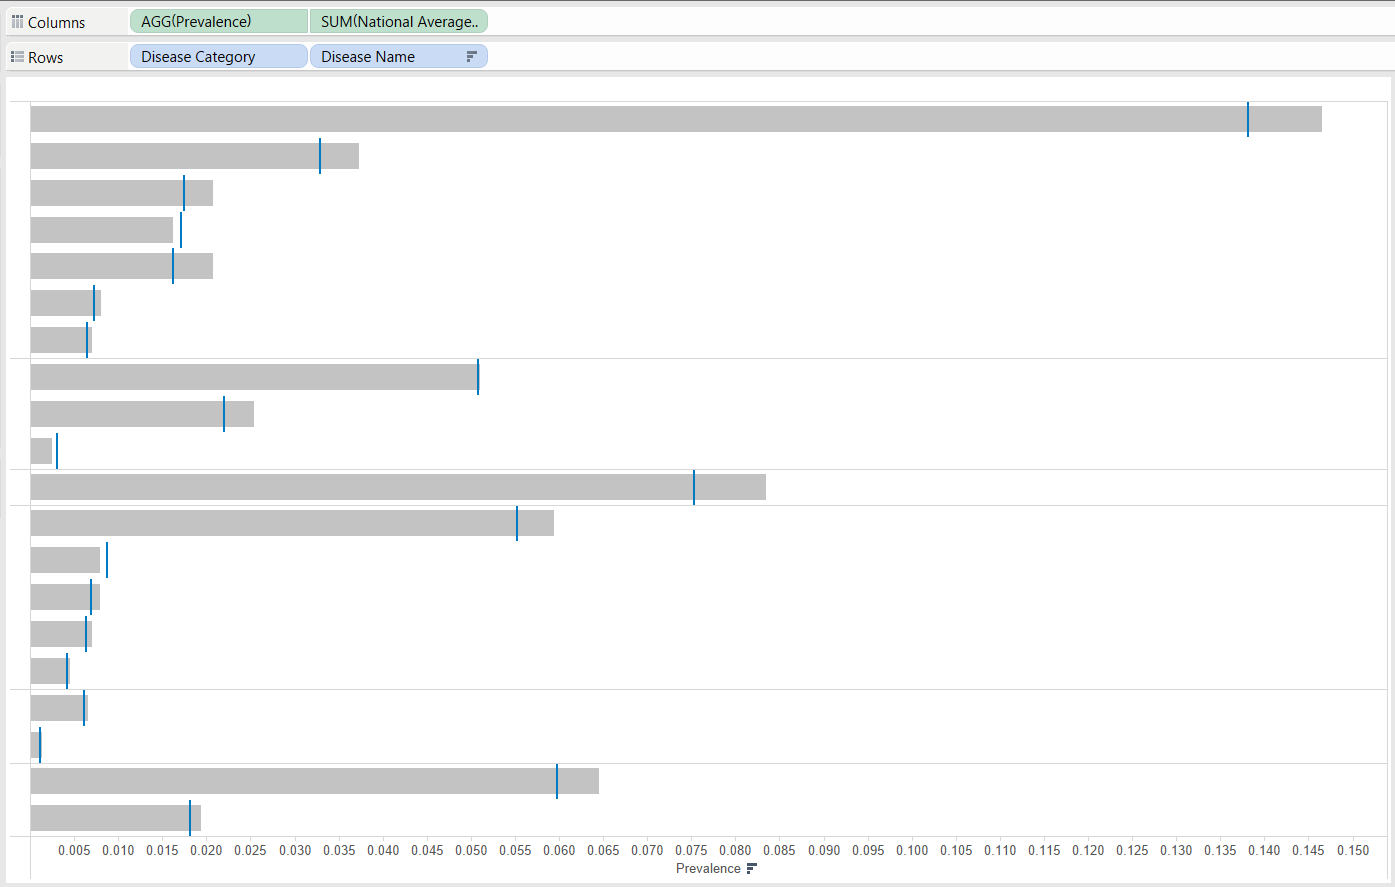
I was then able to make the bullet chart below, showing the prevalence of my selections of diseases in grey, and see how it compared to the national average in blue, by plotting both on a dual axis graph. Yeay!
Further reading: http://onlinehelp.tableau.com/v9.0/pro/online/windows/en-us/help.html#calculations_calculatedfields_lod.html