


Data Visualisation for Noobs (Like Me)! Mapping To and From Points – Part 1
Creating To and From Points: Cartesian Joins in Alteryx
I’ve been meaning to write a blog about dual axis mapping for a while now. I’ve finally found a data set that is fun to work with. It’s a data set I got from fellow dataschooler Naledi, during our teaching week, about the Tube Stations in London.
I ran into the problem, that the data wasn’t set out correctly, for me to be able to map the ‘to’ and ‘from’ stations and filter through them so that you can select your ‘to and ‘from’ stations and have both stations displayed on the map.
It turns out, what you need, is to have a row for each ‘to’ station with each ‘from’ station. This can easily be done in Alteryx, using the ‘Append Fields’ tool, which creates a Cartesian Join.
Here’s the theory behind the join:

And here is what it looks like in Alteryx:
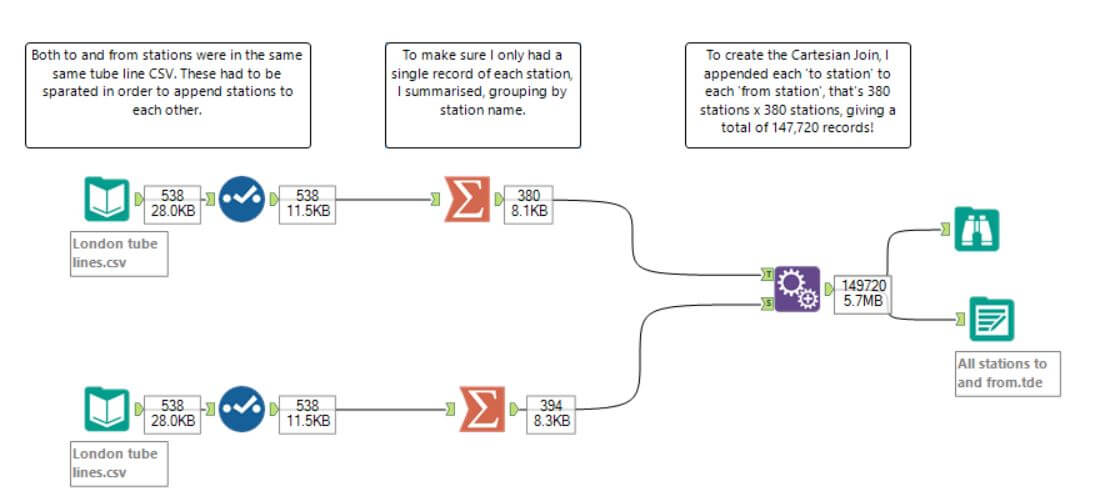
All you need to do, is bring in both of your columns of stations into alteryx. In my case, they were in the same file, so I simply brought in the same files twice and selected only the fields I wanted to bring in and then summarised by station, to make sure I had no duplicates. Then I brought in the ‘append fields’ tool, which needs no setup in this case and outputted the data to .tde so I could map the stations.
To find out how to do the mapping in Tableau, please see Mapping To and From Points – Part 2, Creating To and From Points: Dual Axis Mapping in Tableau (http://wp.me/p6XID2-1oq).