Data Visualisation for Noobs (like me)
Alteryx – UK City Polygon Mapping

This week I’m really excited to be working on a side project with Pint of Science, for which I wanted to build a map that shows the outlines of each of the cities that have taken part in the Pint of Science Festival 2016. Whilst I know that Alteryx is fantastic at spatial and mapping tasks, these are things I know very little about, so this was quite a learning experience for me.
What I learned, is that the most used shape files that we have available to us, have polygons at a much more granular level, for example LSOAs, or by post code, and I was having trouble finding anything at the city level. But, I did manage to find a way around this.
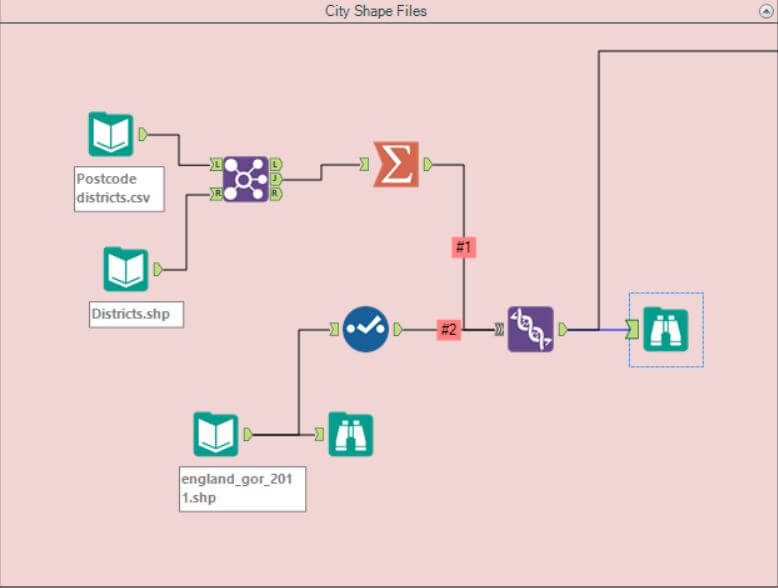
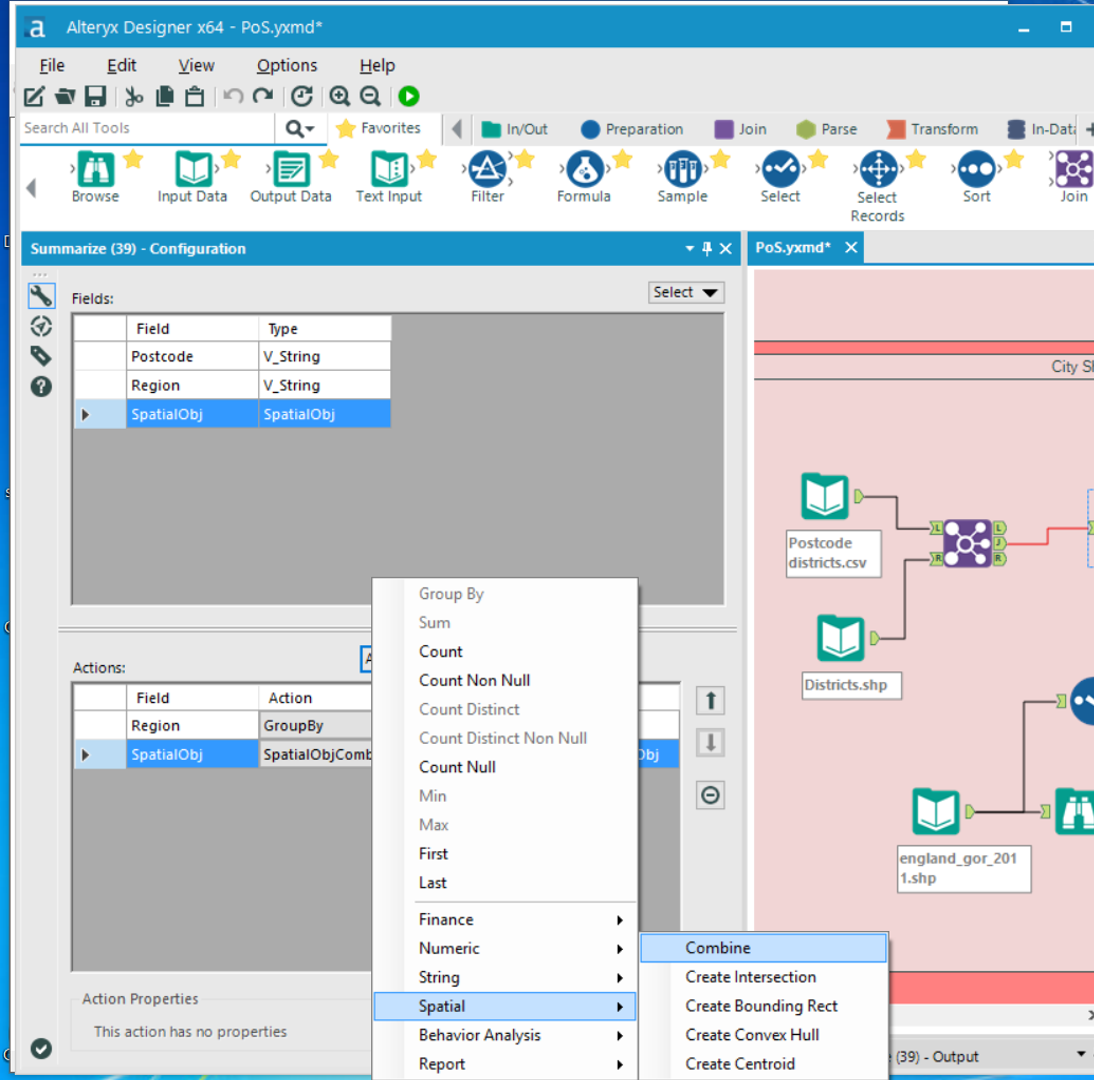
This was in my case, a two step process. In the first step, I used the the postcode shape file that we already had available, and found that you can summarise by geographic area. Place your summarise tool in after your join, group by, in my case, region. Then add the spatial objects into your actions and pick spatial and then combine.

However, to summarise by city, you need to have this information in your shape file using a postcode to district lookup. I was able to download this list from https://www.doogal.co.uk/PostcodeDistricts.php and join it onto my file postcode file. The problem I faced then, is that in breakdowns of the UK by district, whilst you get your data on city level everywhere else, London is broken down by boroughs.
In my efforts circumvent this problem, I stumbled upon this gem of a website (although I did have some download problems): https://census.edina.ac.uk/bds.html, where you can get shape files for all sorts of levels and years across the UK. Here I was able to get the shape file for London as a whole and then had to union this onto the rest of the region data.
Hope that helped!
