


Data Visualisation for (not quite) Noobs!: Nested Sorting Using the Rank Table Calculation (with top 5)
I keep stumbling across situations (for example during the Tableau Qualification!) where I need to make a nested sort and I simply cannot remember how to do it. It’s actually super simple, it just always seems to slip my mind, and what better way to make sure I remember it than posting it up on the internet?
One example of where I struggled is finding the top 5 product subcategories, by sales, for each year, using the classic superstore sales sample data. The trick is to duplicate sales, convert it to discrete and then use a table calculation to rank it.
Let’s go through it step by step.
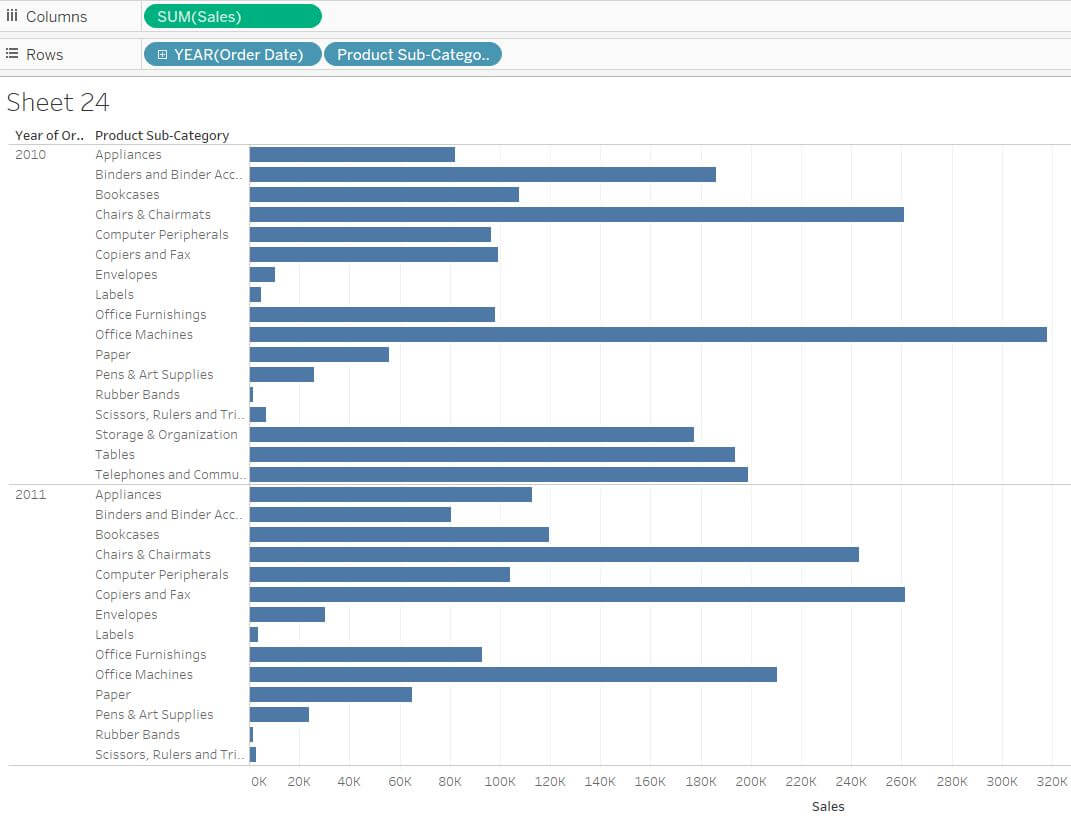
- Connect to superstore sales. Bring sales to columns and year of order date and product subcategory to rows.
2. Now copy your sales pill into your rows (right click and drag), change the pill to discrete (from green to blue) and move it to between the year and the product subcategory.
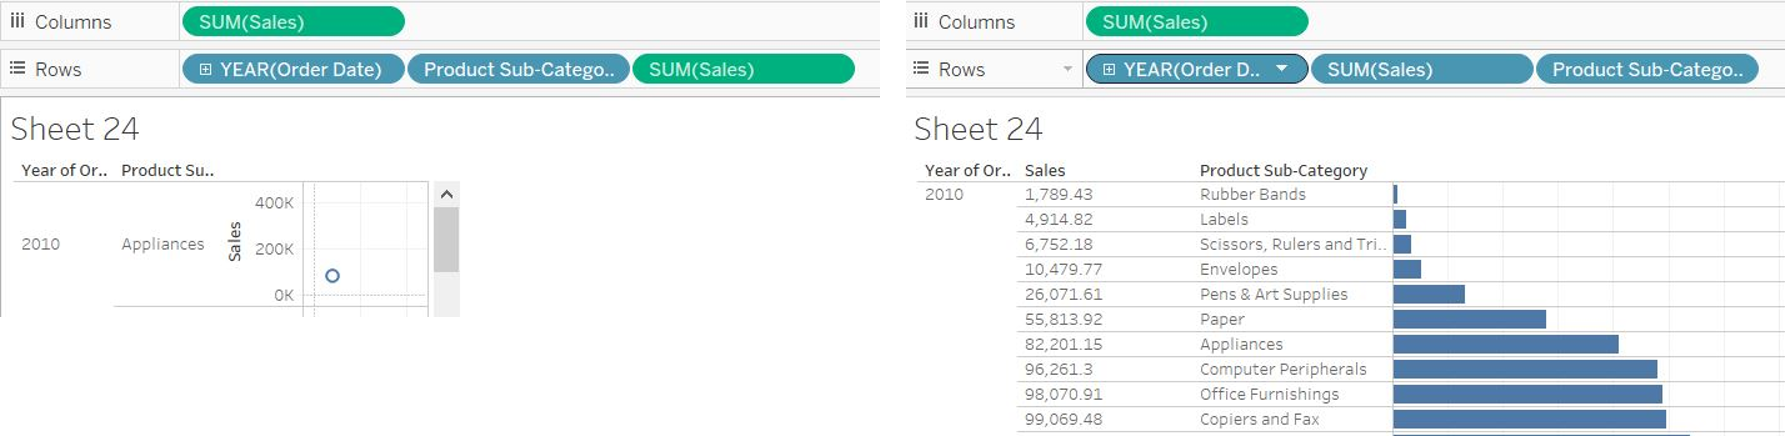
3. Click on the carrot, select quick table calculation and then rank.
![]()
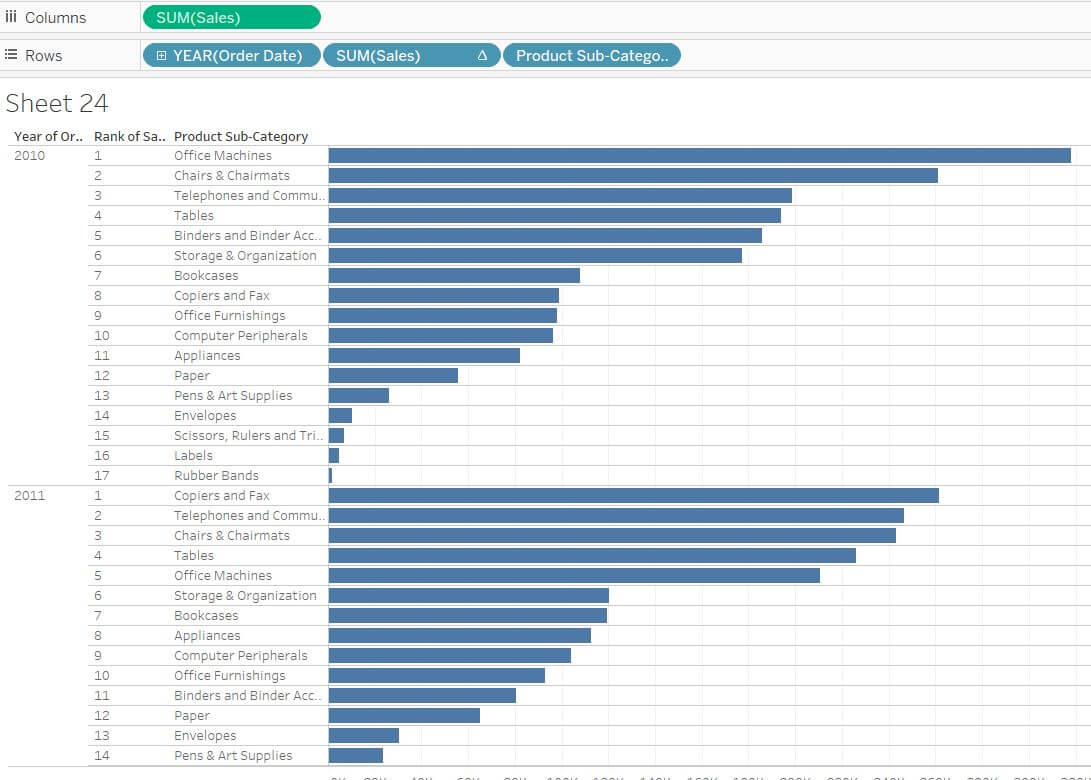
4. Your products are actually already in a nested sort, by descending sum of sales, restarting each year. The ranking is there physically, however, the numerical ranking isn’t quite right. The numerical ranking is actually giving you the rank out of the product subcategories over all of your years. To correct this, click on the carrot on the ranked sales pill, select compute using and then product subcategory.
5. To take this a step further, if you wanted to see the top 5 selling products in each year, you can now bring your sales rank to filters (control, right click and drag from the rows to the filter shelf) and filter in only the top 5 ranks. You can then hide the rank column.
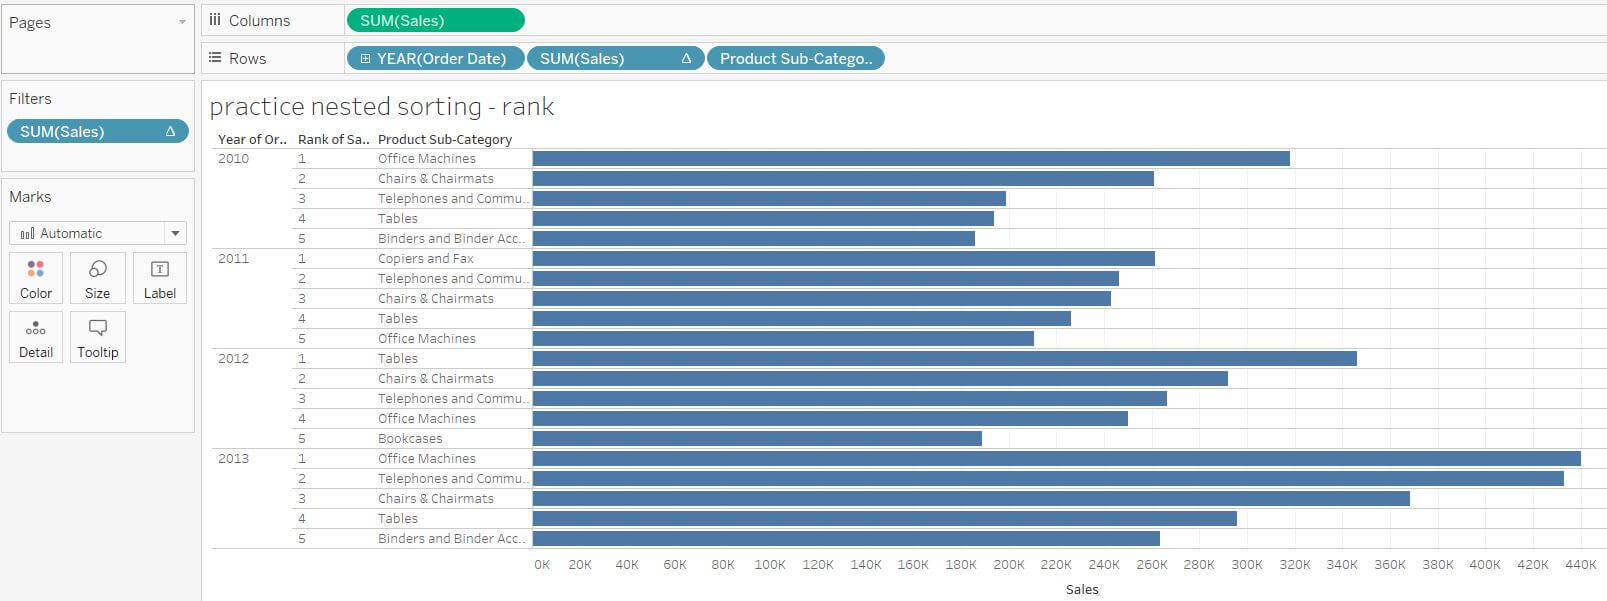
You can now of course format to your heart’s content.
Hope that helped!