Dataschool Antics: #MakeOverMonday – The Workforce Gender Gap
So, practising as I preached in my Tableau for Noobs blog series, I’ve managed to do Makeover Monday today!
Today, the first day of Week 6 of the Dataschool, one of our missions was to to the #MakeOverMonday in one hour with the live Periscope broadcast from the Tableau Conference.
I missed the 1 hour mark very slightly, and I could definitely have done with a few more hours (it’s a little awful)! But here it is: https://public.tableau.com/profile/amanda.patist#!/vizhome/MakeoverMonday13June2016/WorkforceGap
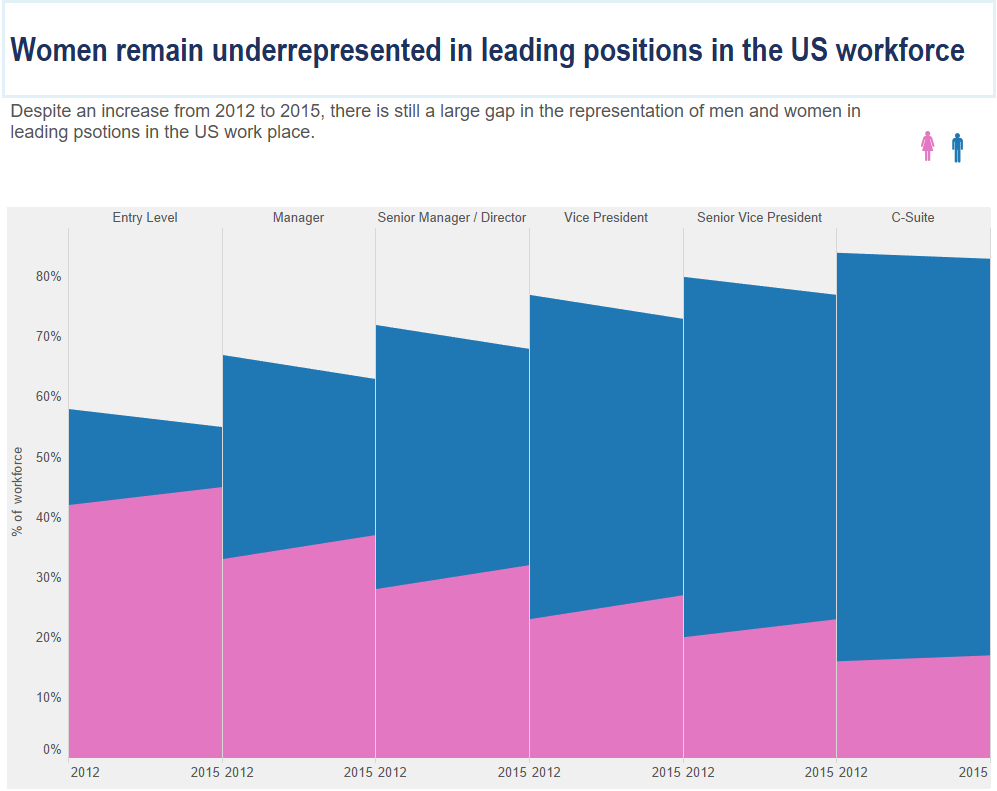
In my quest to make a stacked percentage bar or small multiple area charts over time, as shown in the sketch here 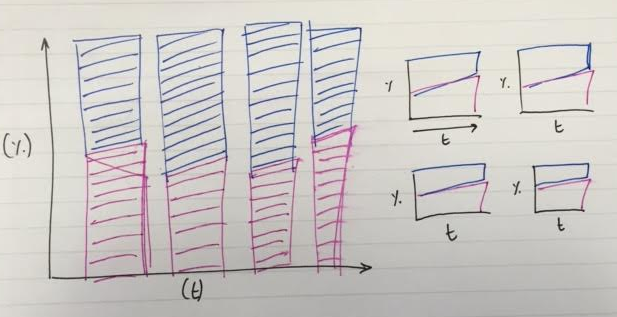 , I came across this dual axis filled area chart, which emphasises the the gap between the genders, but also shows the change over time, and the movement to wards closing that gap!
Ladies, lets keep working to close that gap!
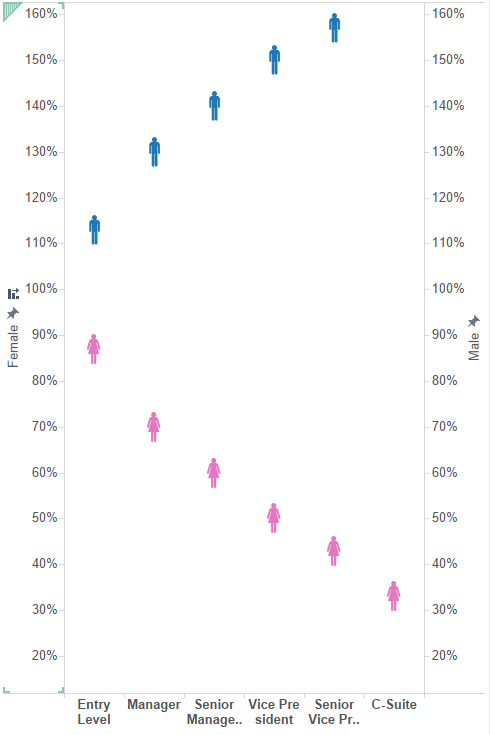
P.S. Another favourite was the one below, but this didn’t make the final cut!