


Tableau Next: "Agentic analytics that delivers personalized, contextual, and actionable insights everywhere work happens." But what does that even mean? Tableau Next is native to Salesforce, and gives users an opportunity to interact with an AI agent to ask questions of their Data.
It's main benefit for Salesforce customers is that a user can take action on their dashboard without leaving. They don't need to jump into a separate system – rather, a user can view an insight that inspires action (for instance if a dashboard indicates that a certain account is at churn risk) and use salesforce to escalate a solution.
Challenge:
We're going to try to recreate some of our favorite features from Tableau Desktop in Tableau Next.
We already have built a Monthly Performance Overview Dashboard using Superstore data:
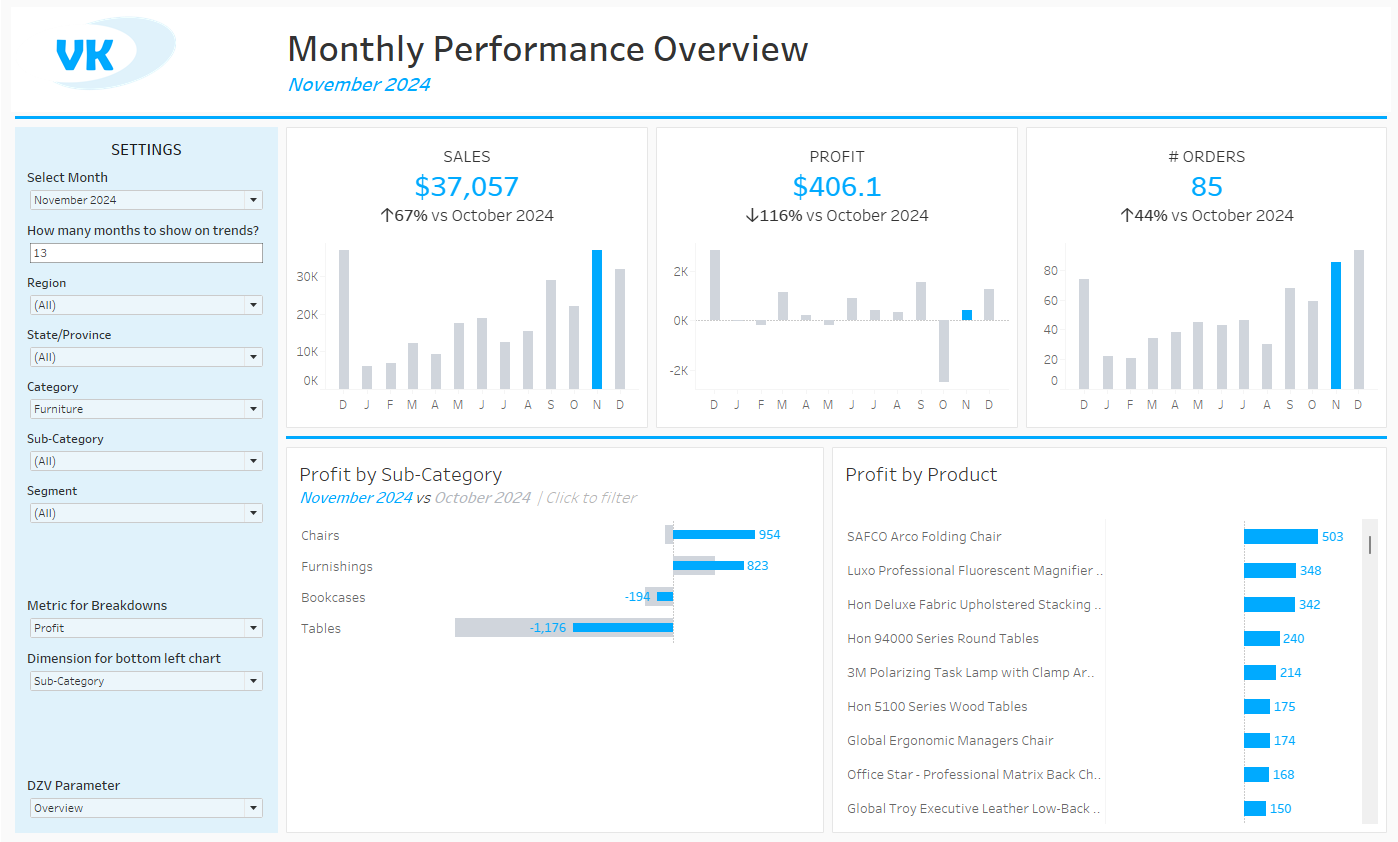
The user of this Dashboard can answer a few questions at the level of their selected month:
1) Overview KPIs:
- Sales: How much have we made in sales this month across the whole business? How did that compare to the previous month? Where does this month's sales stand compared to all other months this year?
- Profit: How much profit has been made this month? How did that compare to last month? How does this month's profit compare to all other months this year?
- Orders: Similar questions as above, comparing this month's totals to last months and visually representing its' status overall this year.
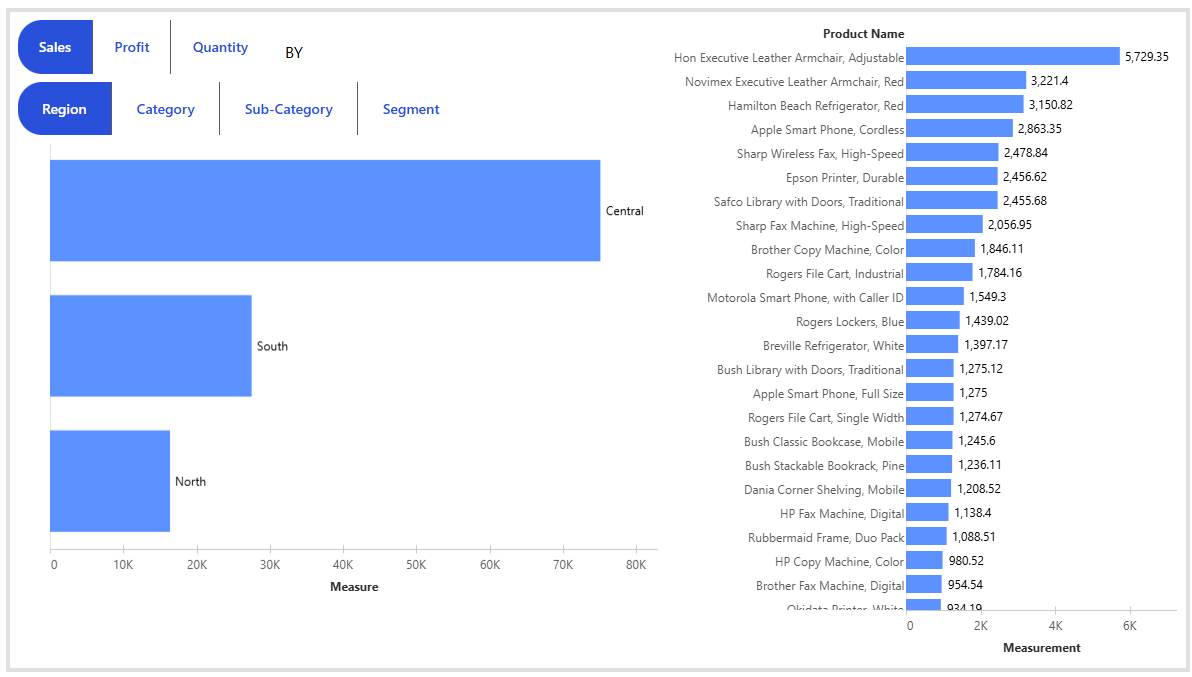
2) Breakdown:
- The user can drill down to one of those above metrics (Sales, Profit, or # Orders) by a selected dimension (Region, Category, Sub-category, or Segment) and view in the bottom left chart. For each metric and dimension, the user can understand which sector was performing the best or the worst compared to others, and how that sector did compared to the previous month.
- The bottom right chart will show a breakdown of products by the selected metric.
3) Filters:
- Users can filter the overall dashboard, including these KPI's, a number of ways.
- They can chose to view one or multiple Regions, States, Categories, Subcategories, and Segments.
- They can use the drill down chart on the bottom left to implement some of these filters.
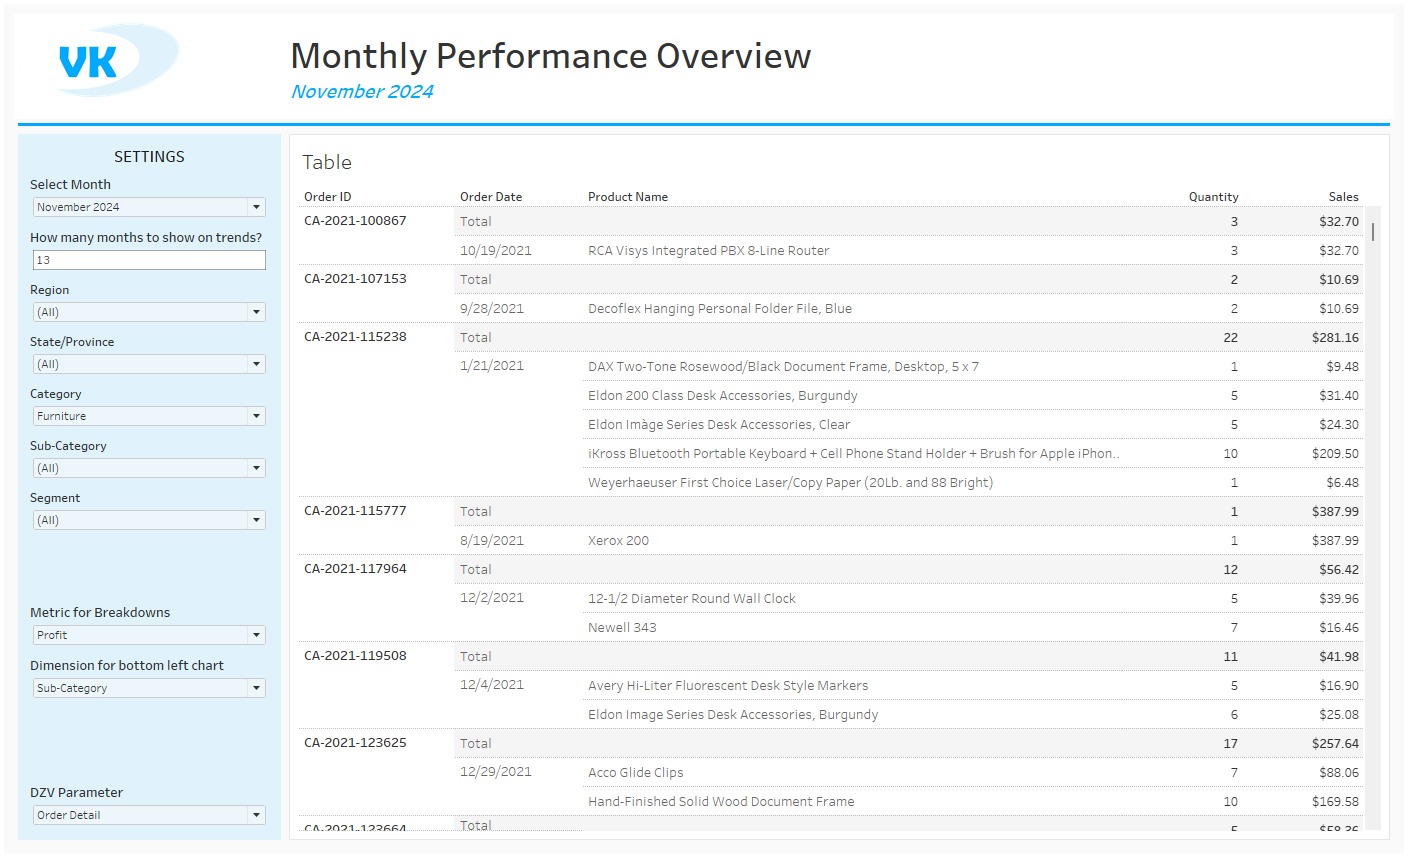
4) Views:
- The user also has the option to switch from the Dashboard View to a Table view, listing the order ids, date of order, total sale, as well as an itemized breakdown of the products included in that order and their quantities.
So lets begin by recreating the questions answered in these KPI cards. We have a big overall number, a percentage increase from the previous month, and a user-defined timeline for a bar chart with tooltips showing the monthly totals.
Parameters:
In Desktop, you can create a parameter from the data pane in any sheet. In Next, parameters are only available in the semantic model.
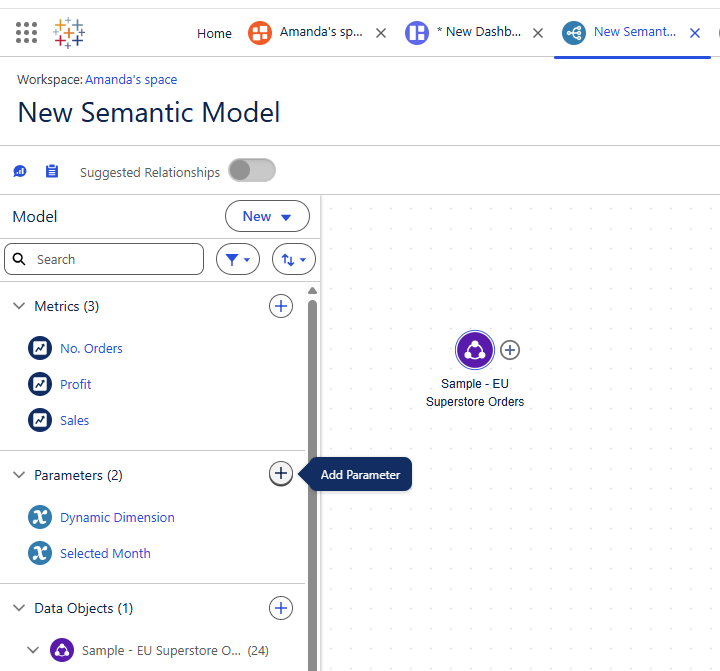
When you use a list parameter, you can easily add this to your dashboard from the list button. You can use parameters in calculations as you would in Tableau.
However, I don't recommend this approach. I really struggled to figure out how to add a single select date parameter to my dashboard. Since I used metrics as KPI's, it turns out I actually only needed to configure my metrics to a specific time period, and Tableau Next calculated what was expected in the previous period.
Opportunities and Limitations:
For folks not native to Tableau, the metric cards are very helpful. With the selection of a few check boxes, you can generate insights.
The grid layout for the dashboard ensures your dashboard almost always looks clean. This is clearly a business intelligence tool over something that can artfully tell stories.
Since you can set a period to look at overall on a metric card and Tableau Next will calculate that change for you from the previous period, this can drastically reduce the number of calculations you need for those KPIs. However, this also means that customization of what periods you can compare is limited.
The user interface is not intuitive yet to experienced Tableau users. I struggled to locate all my parameters, figure out how to create a month selector, and was limited by the lack of features allowing period comparisons.
Dynamic titles and axis labels are not currently available. Where I would usually hide an axis title or have it dynamically change based on a selected parameter, instead we need to be creative, naming the field or axis something that makes sense for all selections.
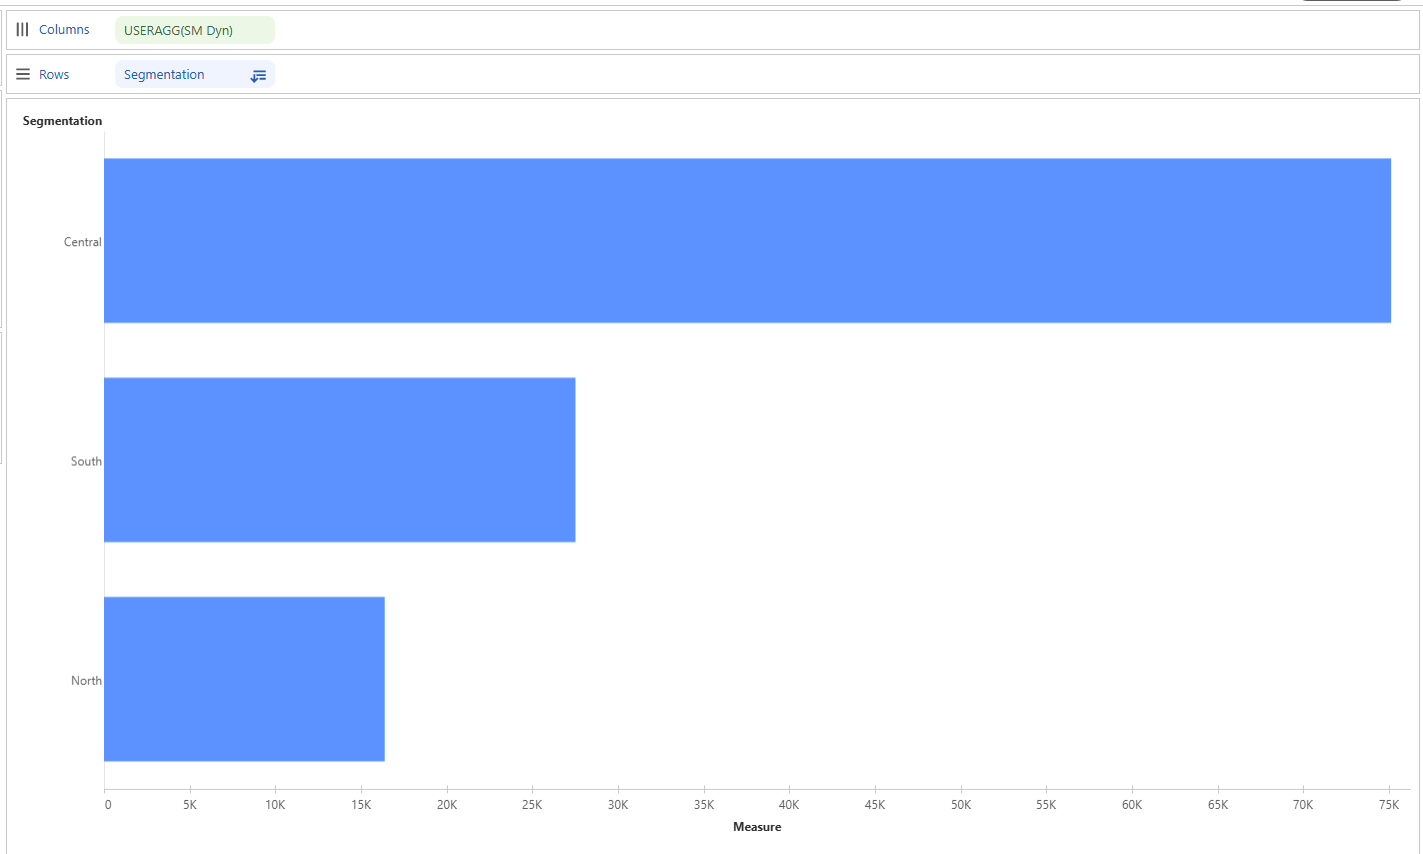
My workaround was to use the toggles as the title, and add labels for each bar. This makes the profit bars being measured by that dynamic segmentation a little unclear, but I think it was a clever solution for that chart!
Takeaways:
Tableau Next is a new product with constantly evolving features. For instance, the text table feature is still still in Beta, so not all users have access to that. Save your work often, because if you're trying to build something as robust as a Tableau Desktop business Dashboard, you're probably pushing the limits of this platform's current capabilities.
Have patience, and approach using the tool with curiosity! Give yourself ample time for formatting, as this is an entirely online tool bridging tableau features with an already dense Salesforce Platform. Ultimately, the value is for Salesforce users who want to be able to take action in just one platform, instead of having to switch through many tabs. So the simpler the better.
I also think the metric cards have great potential! These function similar to Pulse metric cards, where Tableau Next generates insights for you. Sentences like this take more complex calculations in desktop, so this will be a valuable feature once it functions reliably without crashing.