


In Part 1, we discussed Basic Calculations in Tableau Desktop so now it is time to move onto Level of Detail Expressions (LODs)!
Here is a quick reminder of the types of calculations available in Tableau Desktop:
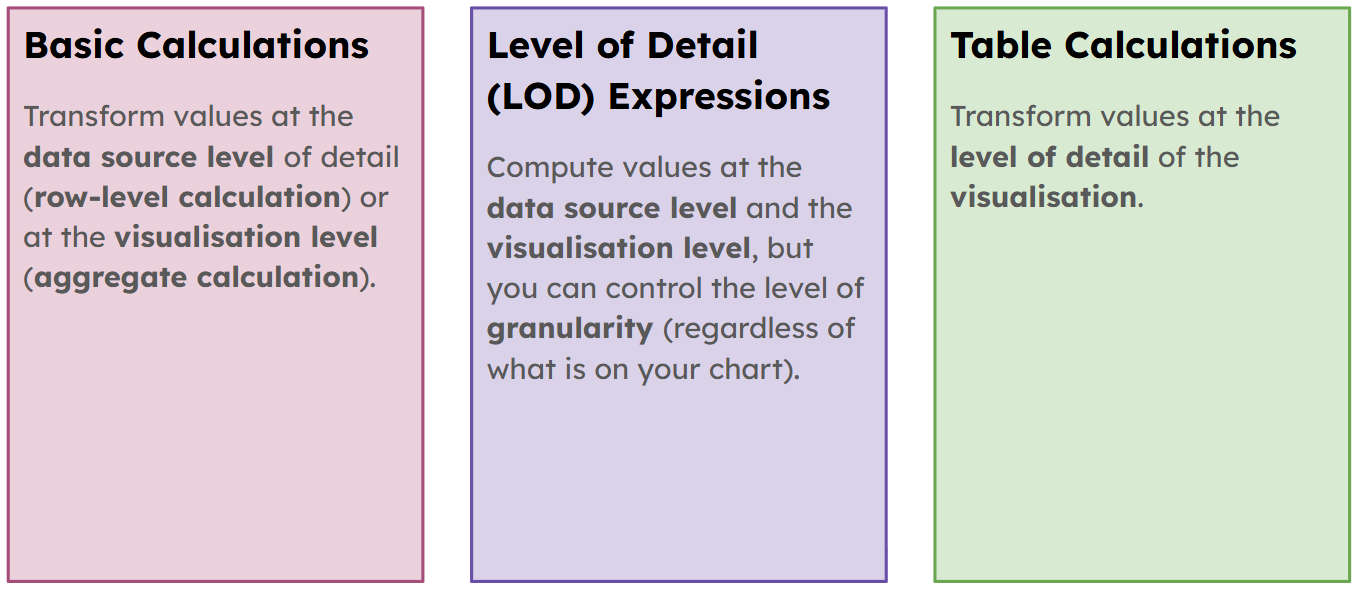
LODs are types of calculations which allow you to compute values at a specific level of granularity, independent from the dimensions currently displayed in your view. For example, if I have a chart showing sales at individual store locations, I could use an LOD to calculate average sales per region.
There are 3 types of LODs:
- INCLUDE
- EXCLUDE
- FIXED
INCLUDE LODs
- INCLUDE LODs calculate values at a more detailed (granular) level than what is shown on your visualisation by forcing Tableau to consider extra dimensions behind the scenes.
- They are useful when you want to calculate at a more detailed level in the data, but aggregate at a different level of detail in your view.
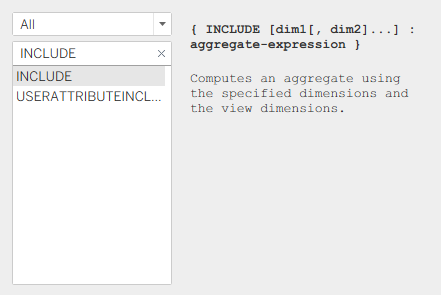
INCLUDE LOD Syntax
{ INCLUDE [Dimension 1], [Dimension 2], ... : AGGREGATION([Measure]) }
- It is important to note, that you do not have to include a dimension inside an INCLUDE LOD expression. For example, if you omit the dimension declaration and write the following expression
- { INCLUDE : SUM([Sales]) }
- Tableau will evaluate the expression at the level of detail that is in the current view.
- You can also include multiple dimensions, for example:
- { INCLUDE [Customer Name], [Order ID] : SUM([Sales]) }
- This tells Tableau to sum up [Sales] for every unique combination of [Customer Name] and [Order ID] (each customer's order).
INCLUDE LOD Example
In the data set, Sample - Superstore, one row is a single [Product Name] in an [Order ID].
If we would like to visualise the Average Customer Sales per Region, we can use an LOD.
In the chart below, we have not used an LOD. Instead, AVG(Sales) is on Columns and [Region] is on Rows. This gives total regional sales, not per customer. This is where an LOD should be used, to give a more granular view of the data (in this case we want average sales to be calculated at the customer level, not regional level).
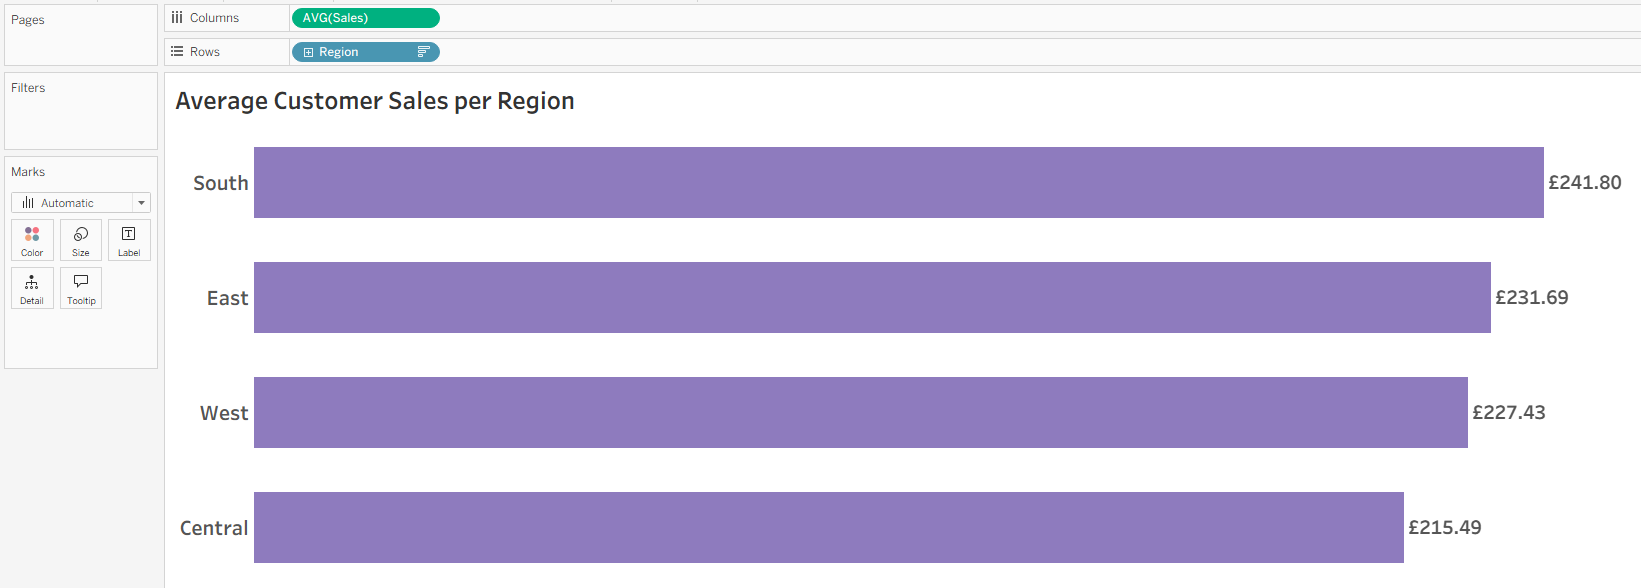
From this chart, we can see that the average sales are the highest in the South region. If we would like to see it at a more granular (customer) level, then we need to create a calculated field and compute an INCLUDE LOD.
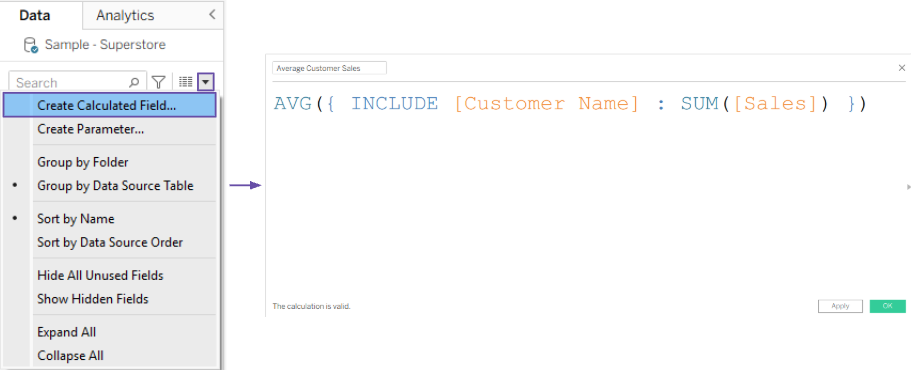
{ INCLUDE [Customer Name] : ... } forces Tableau to bring [Customer Name] into the calculation it is performing, even though [Customer Name] is not in our view.
SUM([Sales]) sums up all [Sales] for each [Customer Name].
AVG(...) aggregates the customers total sales by taking their average at the visualisation level ([Region]).
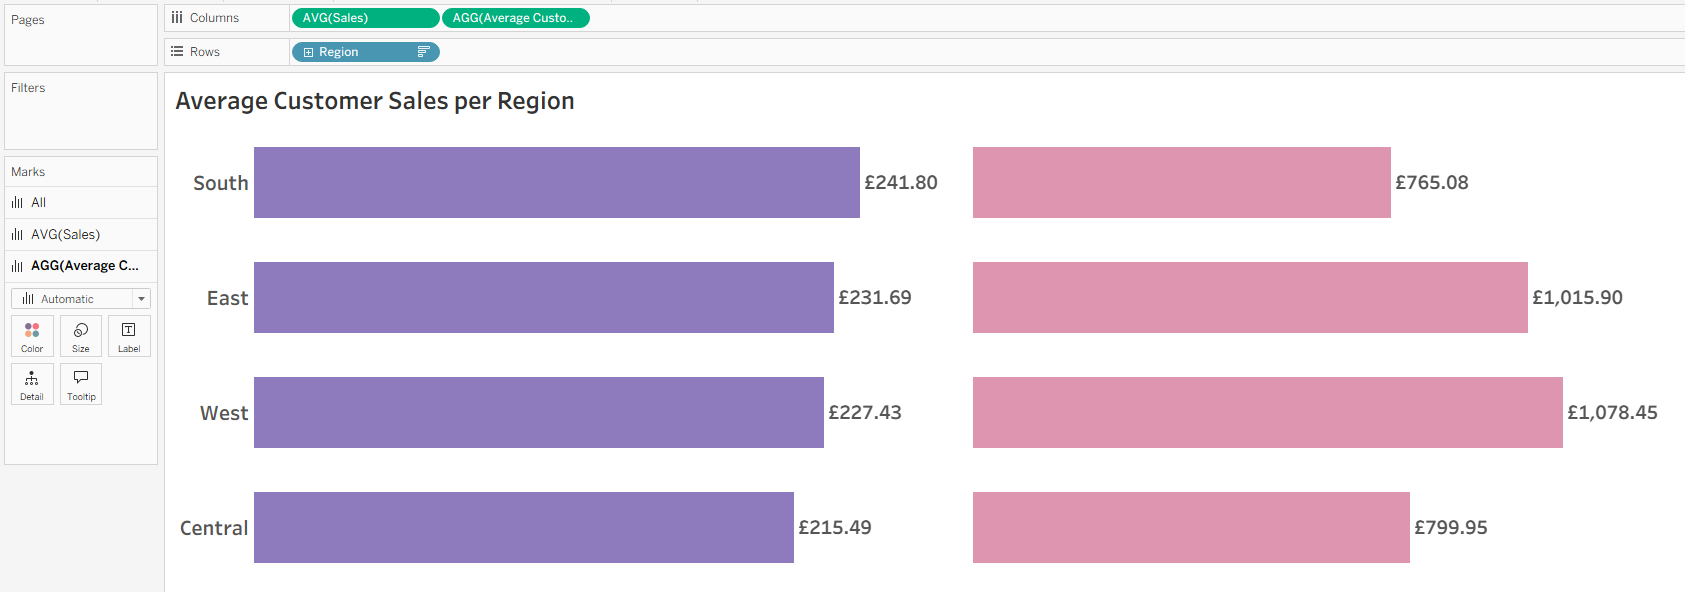
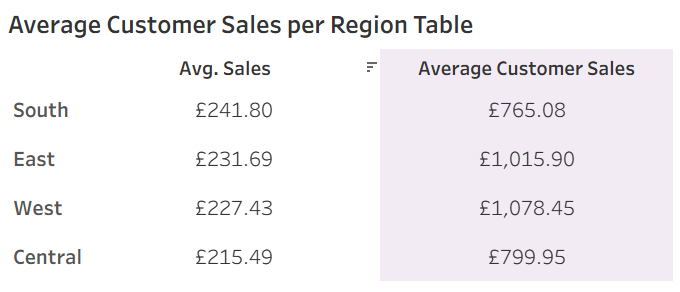
Here, the pink bars represent the values calculated using the INCLUDE LOD and the purple bars are the original AVG(Sales). We can see that the values are very different, and West is now the region with the highest average customer sales. This highlights the importance of using an LOD when necessary, as it can significantly impact your visualisation.
EXCLUDE LODs
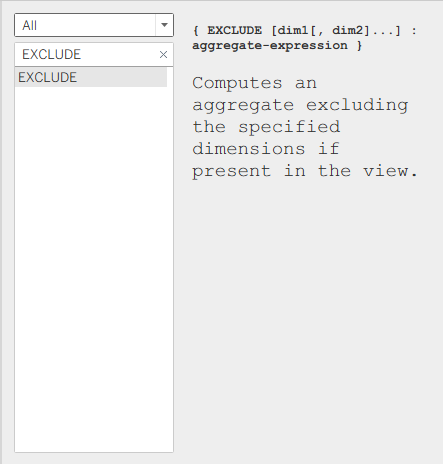
- EXCLUDE LODs calculate values at a less detailed level by intentionally removing specific dimensions from the view level of detail.
- They force Tableau to ignore specific fields on your visualisation when aggregating.
- These LODs are commonly used for Percent of Total or Difference from Overall Average calculations.
- They cannot be used in row-level expressions.
EXCLUDE LOD Syntax
{ EXCLUDE [Dimension 1], [Dimension 2], ... : AGGREGATION([Measure]) }
- It is important to note, that you do not have to include a dimension inside an EXCLUDE LOD expression. For example, if you omit the dimension declaration and write the following expression
- { EXCLUDE : SUM([Sales]) }
- Tableau will evaluate the expression at the level of detail that is in the current view.
- You can also include multiple dimensions, for example:
- { EXCLUDE [Customer Name], [Order ID] : SUM([Sales]) }
- If I have a view with [Region], [Customer Name], and [Order ID] on Rows, using this EXCLUDE LOD tells Tableau to ignore [Customer Name] and [Region] when calculating SUM(Sales). So the only remaining dimension being used to calculate SUM(Sales) is [Region].
EXCLUDE LOD Example
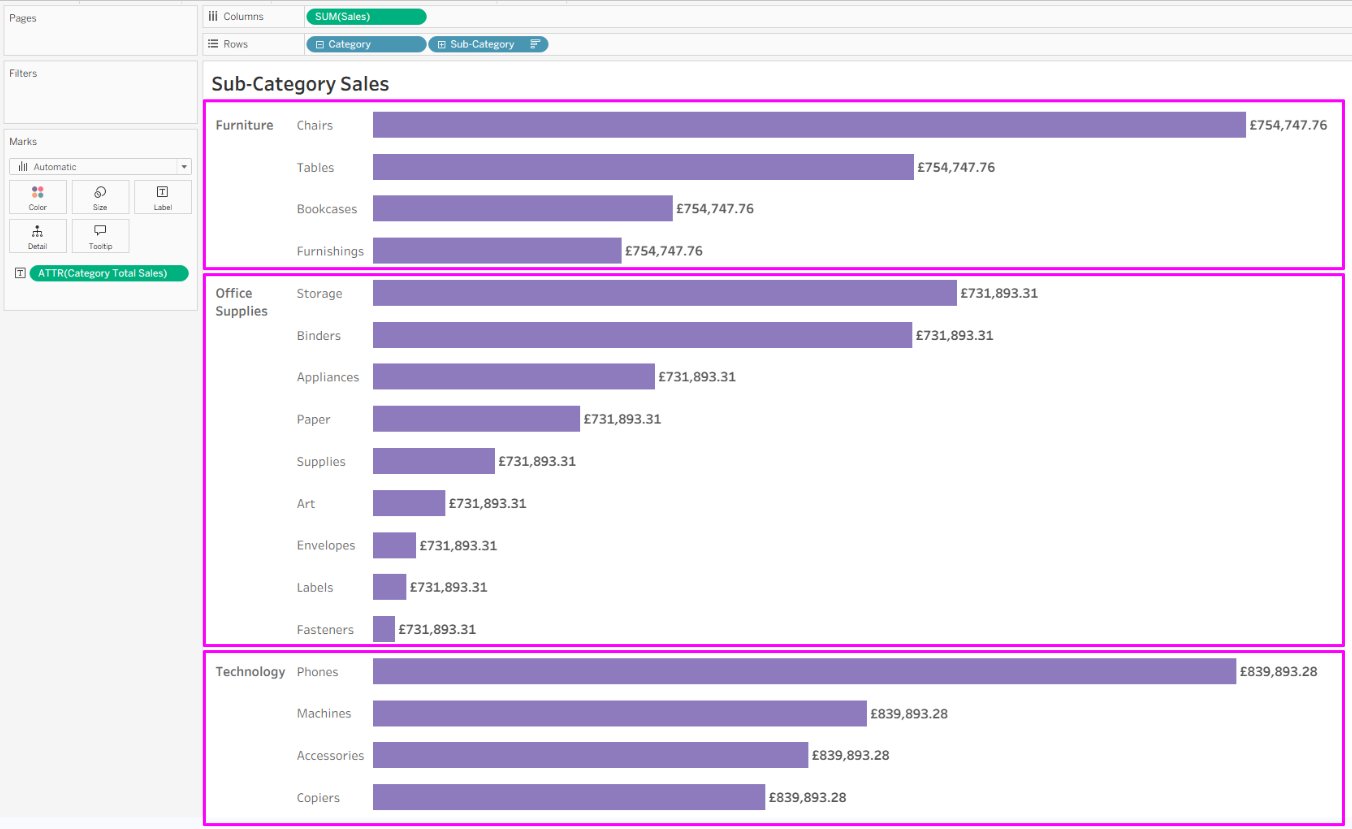
Imagine that we would like to build a detailed view showing [Sales] broken down by [Category] and [Sub-Category]. We would like to see the Total [Category] Sales next to each [Sub-Category] sales so we can calculate each [Sub-Category]'s percentage contribution.
The level of detail in the visualisation is at the [Category] and [Sub-Category] level (detailed view).
The desired level of detail is at the [Category] level, ignoring [Sub-Category] (less detailed view).
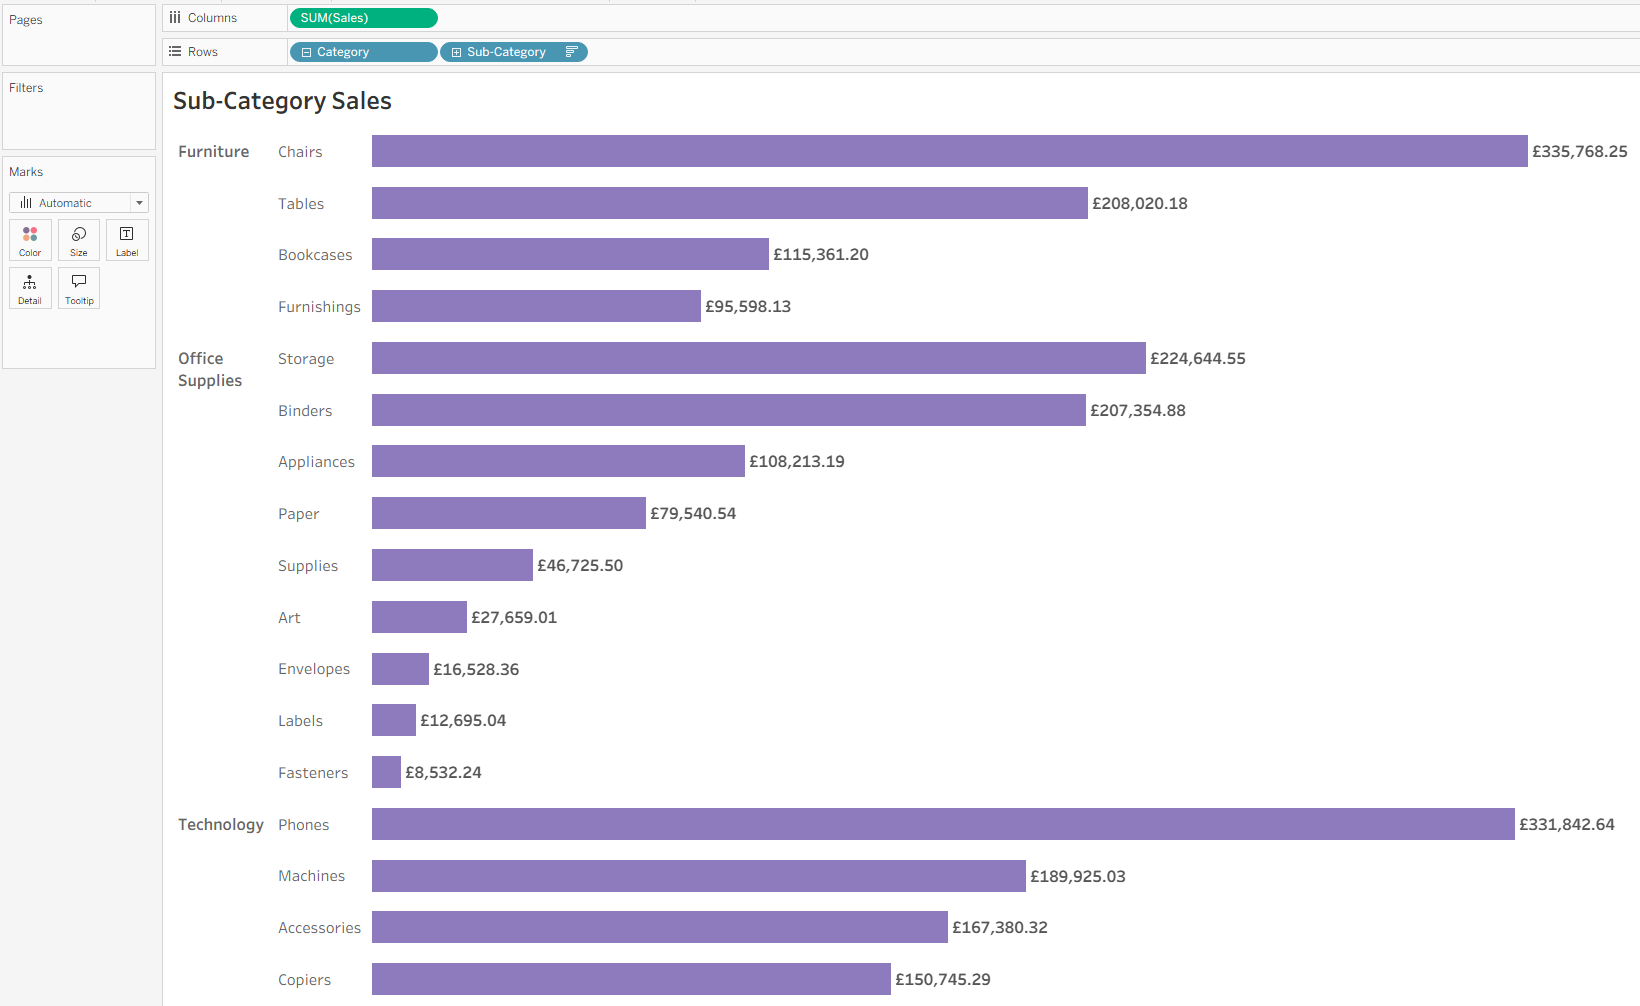
Currently, the text next to each bar shows the [Sub-Category] sales, but we would like to see the total sales for that [Category] .
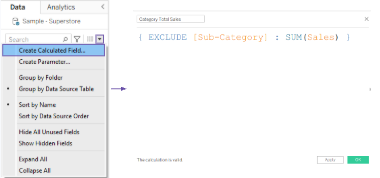
{ EXCLUDE [Sub-Category] : ... } tells Tableau to look at the visual, but temporarily ignore [Sub-Category] when running this sum.
SUM([Sales]) because [Sub-Category] is being ignored, Tableau needs to sum the sales up to the next available level of detail in the view ([Category]).
So putting this EXCLUDE LOD [Category Total Sales] onto the Text Card, gives us the same values for each [Sub-Category] in a [Category].
FIXED LODs
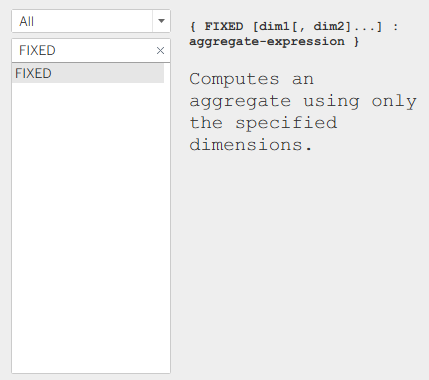
- FIXED LODs compute values using specific dimensions regardless of what is in the view.
- They ignore all filters in the view (except context filters, data source filters, and extract filters).
FIXED LOD Syntax
{ FIXED [Dimension 1], [Dimension 2], ... : AGGREGATION([Measure]) }
- It is important to note, that you do not have to include a dimension inside an FIXED LOD expression. For example, if you omit the dimension declaration and write the following expression
- { FIXED : SUM([Sales]) }
- Tableau will calculate the measure across the entire dataset.
- You can also include multiple dimensions, for example:
- { FIXED [Customer Name], [Order ID] : SUM([Sales]) }
- Tableau looks across the entire dataset and groups rows by unique combinations of [Customer Name] and [Order ID] and calculates SUM(Sales) for each order.
FIXED LOD Example
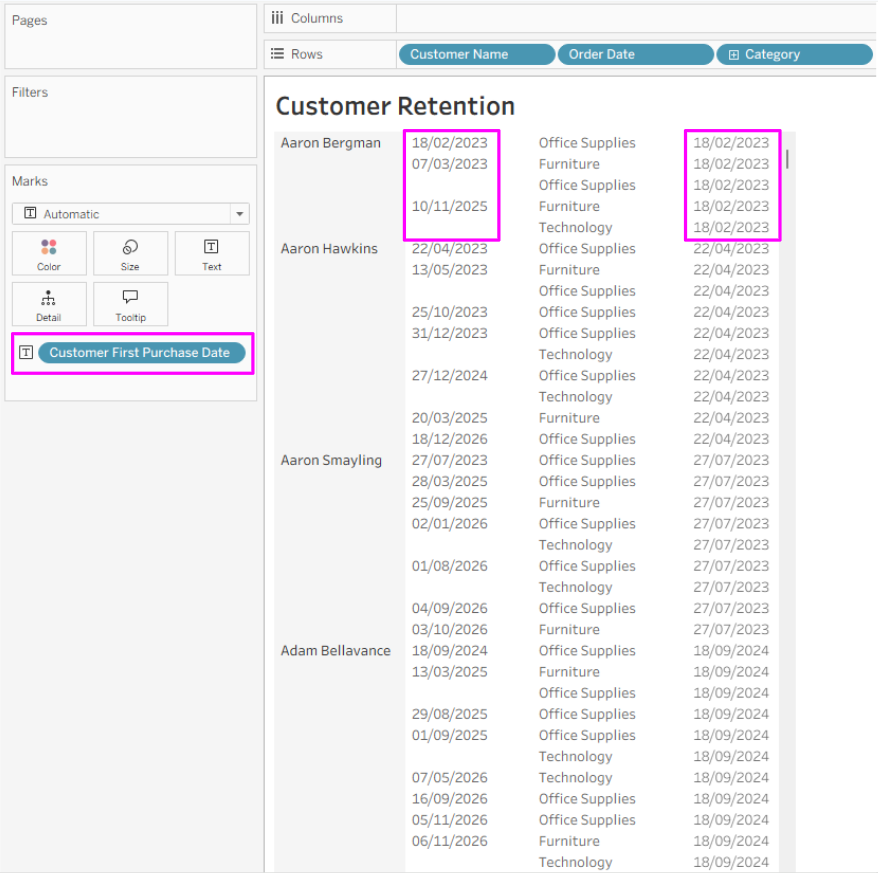
Imagine we would like to analyse customer retention. We need to know the exact date a customer made their very first purchase, and display that alongside every subsequent order that customer makes - regardless of how the view is broken down or filtered.
The level of detail in the visualisation is at the [Customer Name], [Order Date] and [Category] level.
The desired level of detail is at the MIN([Order Date]) level for each customer across the entire dataset, ignoring everything else in the view.
Using a standard MIN([Order Date]) calculation when you have individual orders in the view simply evaluates to the date of that specific order, not the customer's true historical first purchase.
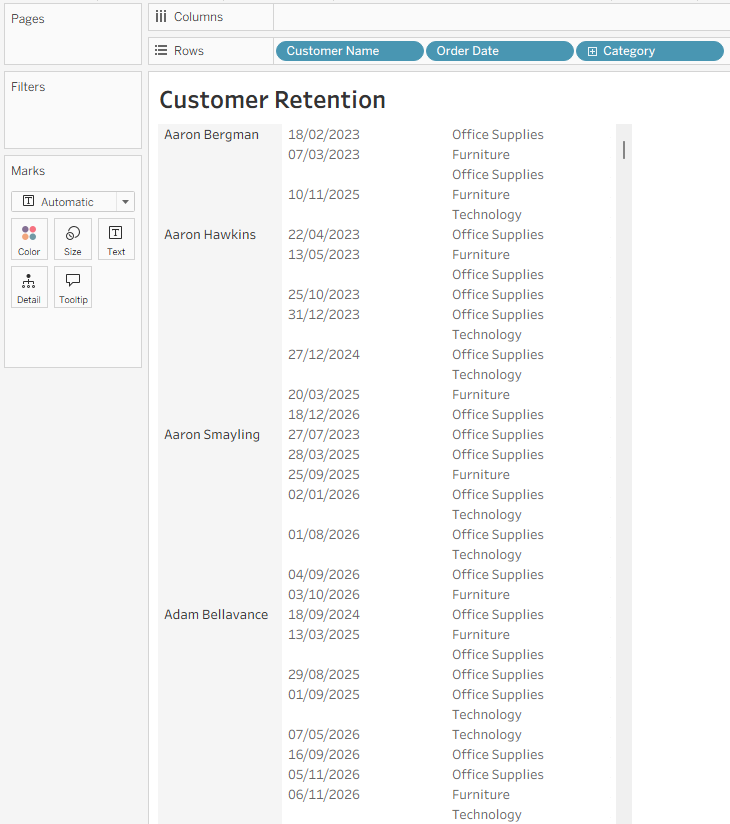
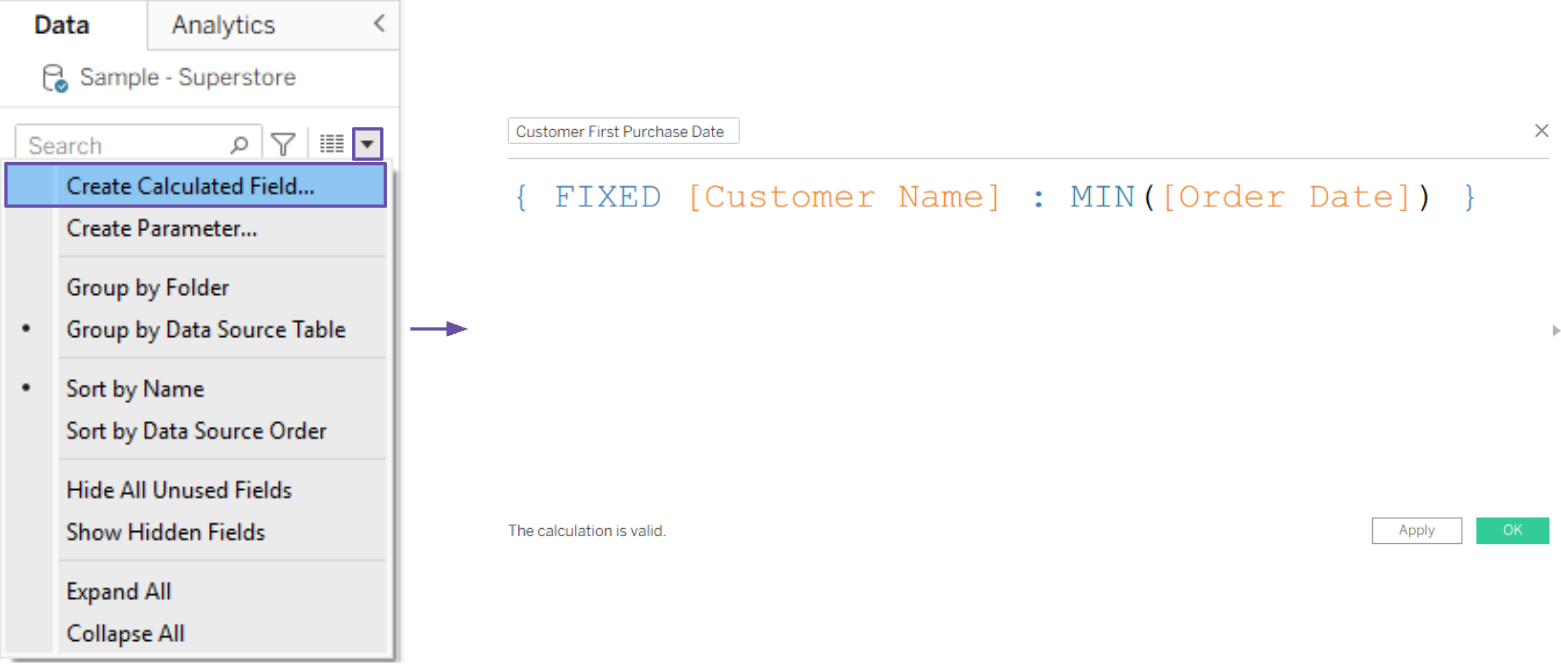
{ FIXED [Customer Name] : ... } tells Tableau to lock this calculation strictly to [Customer Name] and ignore any dimensions that are dragged onto the canvas (rows, columns, or marks card).
MIN([Order Date]) finds the earliest [Order Date] in the dataset for that specific customer.
Overview
INCLUDE: Tells Tableau to look at what's on the canvas, but add more detail to the calculation.
EXCLUDE: Tells Tableau to look at what's on the canvas, but remove detail from the calculation.
FIXED: Tells Tableau to ignore what is on the canvas, and complete the calculation to specified dimensions.
I hope that LODs are easier to understand after reading this blog. As always, practice makes perfect with Tableau, so have a go at building some charts and using LODs to change what the chart is showing!
Source: https://help.tableau.com/current/pro/desktop/en-us/calculations_calculatedfields_lod.htm