


Day one of Dashboard week - a bittersweet moment - I'm both in shock at how fast 4 months of training has gone by and also slightly apprehensive of how brutal this week might be!
For context, dashboard week consists of a daily project, set by one of the coaches, which will typically involve a data cleaning exercise to prepare it for analysis. From there we will typically be required to create a dashboard. This is set from 9am and we present our outputs at 3:30pm.
The scope of our project for day one can be found in my coach Robbin's blog post here. To summarise, the scope of the project was as follows:
- Scrape the main Backpacker Index page
- Scrape each city’s detail page (hint: focus on the tables)
- Build your dashboard in Power BI
- Prepare for your Presentation (10 mins max)
- Write your blog post, include your plan, challenges, key finding and surprises and a link (embed your public Power BI report in your blog).
This needed to be done in 6 hours.
My Initial Plan
My initial plan for the day was as follows:
- 9:00-10:00/10:30 - Web-scraping and data prep - looking back this was incredibly overambitious! It's been over a month since we covered web scraping in training and it was not my favourite topic of training, nonetheless I was hopeful..."how difficult could it really be?"
- 10:30-11:30 - user stories and sketching
- 11:30-11:45 - break
- 11:45-12:30 - build report in power BI
- 12:30-13:30 - lunch
- 13:30-15:00 - continue building report in power BI
- 15:00-15:30 - practice presenting
How the day actually played out
Since I knew this report had to be done in power BI, I started off with pulling the backpack index table on the webpage in power query, which gave me the following output.
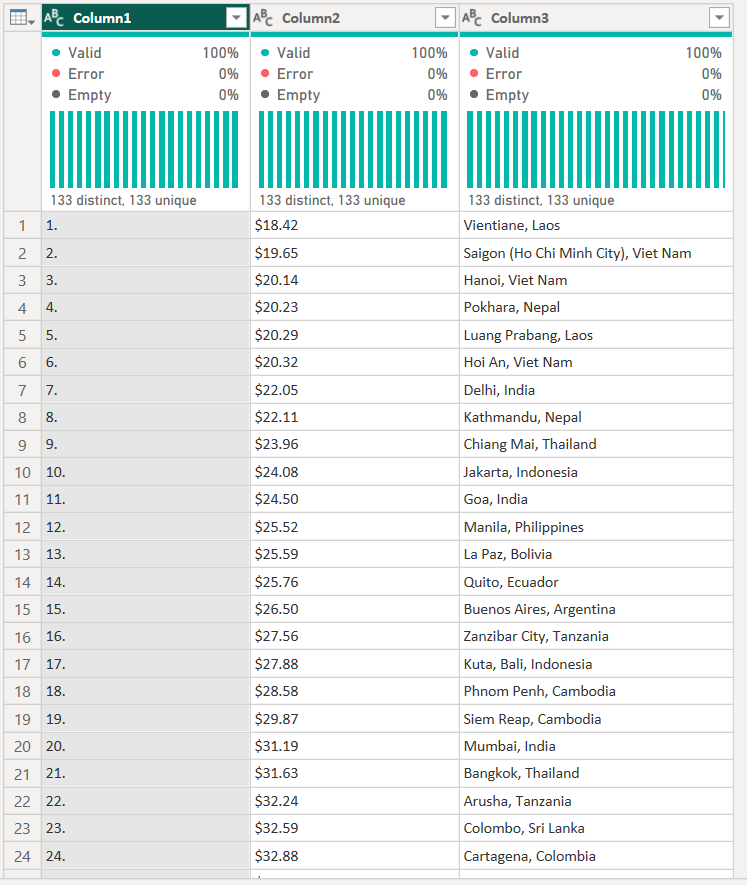
This is when I knew I'd bitten more than I could chew with the time I had assigned for web-scraping and data prep - each city had it's own url with information about the city on the page. On each page were multiple embedded tables relating to numerous things, from the cost of accommodation, cost of top attractions, transport and more! I needed to pull the tables for each city and union them together in order to do any analysis.
I decided to move this process over to Alteryx, as the above is where my knowledge of web-scraping in power BI extends to.
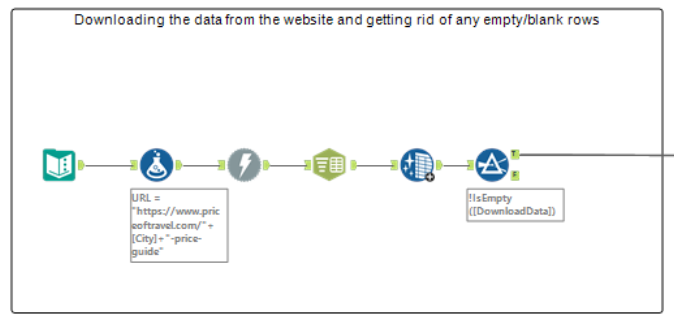
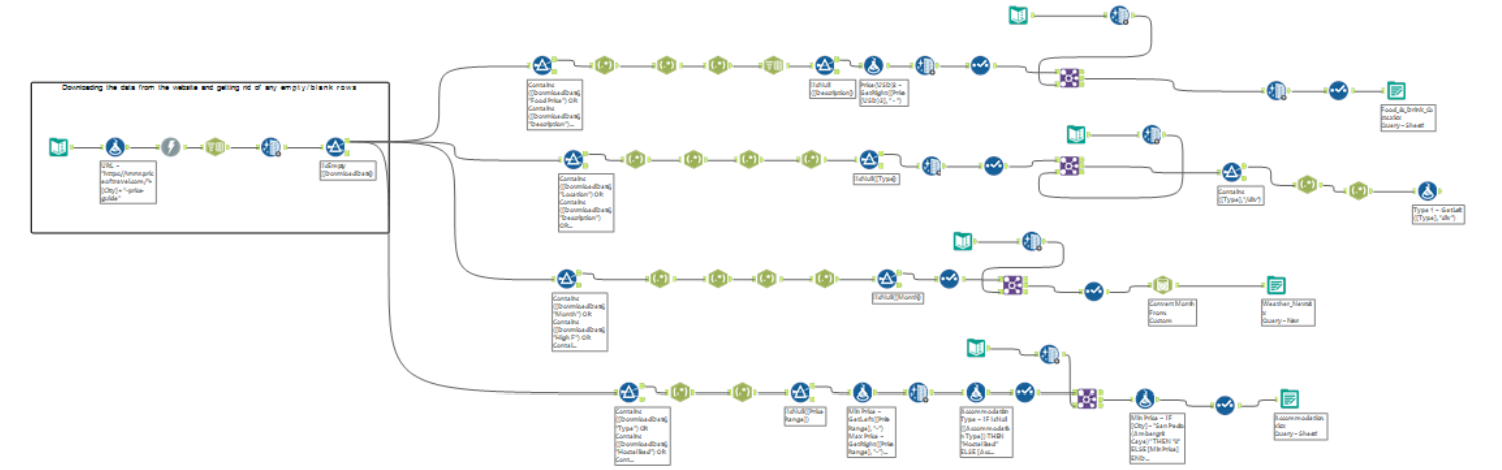
I eventually created quite a large workflow which enabled me to pull a number of tables from all the city's web pages and union them. The first part of the workflow is as follows:
The next part of the workflow was focused on trying to pull the food price table from the webpages. I used a few RegEx tools, amongst a few others, to essentially parse out the columns and values I wanted to form the table I needed. This is shown in the image below.
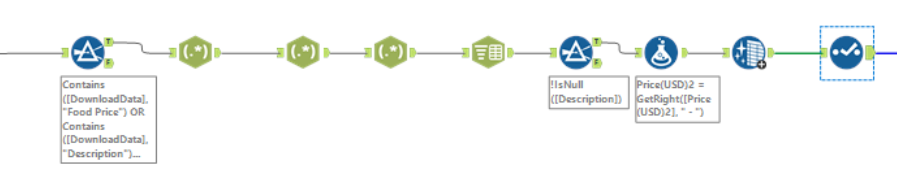
When I saw this worked, I went on to develop/expand the workflow, using the same process to pull the other tables.
My final workflow, which pulls the Food Cost table, Weather table and Accommodation (Hostel) Cost table for all the cities, can be seen below.
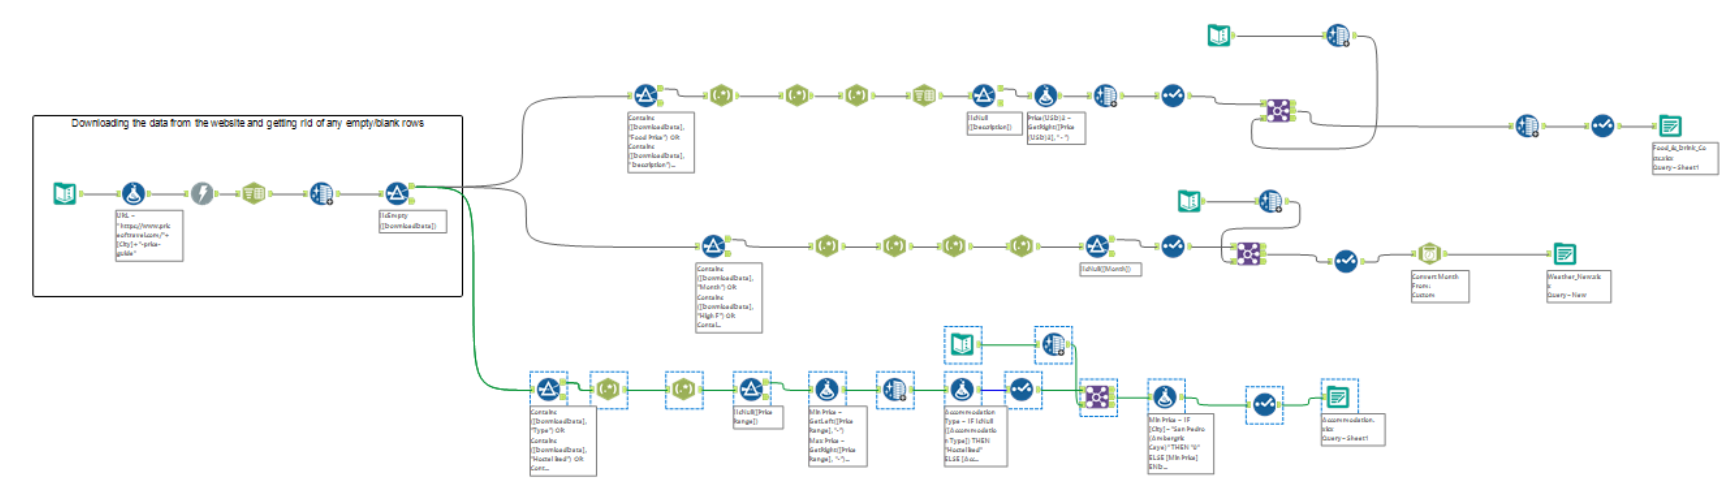
Each table is outputted as an excel file - I opted for this file type to preserve the data types of each field, which would in turn reduce the amount of data prep I would need to do in Power Query.
Data Prep Challenges
I faced a few unforeseen challenges/blockers in the data prep part of this project. This all contributed to this stage taking longer than I had anticipated, nonetheless I persevered where I could.
Challenge 1
I started by testing my workflow for one of the city's page's to see if it worked, and then changed the URL for another city to see if this still worked - there were 133 cities in total so testing each one was not an option, given the time constraints!
However, at first glance it became apparent that the layout for each city's URL was https://www.priceoftravel.com/"[city-name]-price-guide. All I needed to do was input each city's name..so I thought.
There were a number of city's whose name in the URL was misspelt (e.g. Kyiv was spelt Kiev), which meant my workflow didn't initially pull in the tables for those cities. This meant I had to manually change the spelling to the misspelt version (luckily there wasn't that many) and then create a text input with the correct spelling to join back onto the table.
Challenge 2
Initially I had planned to pull all the tables on each page to use in my analysis but the whole process took longer than I had anticipated, and between trying to get my RegEx to work, and other blockers, combined with the time constraints, I had to reduce my scope of the project!
Challenge 3
After settling on not pulling all the tables, I decided to pull the Food Cost table, Weather table, Accommodation (Hostel) Cost table and the Attraction Cost table.
Everything was fine when I tested this workflow for the first two cities. However when I ran this for all cities, I noticed that the layout of the URLs were slightly different for some of the cities that had Child prices etc (instead of just Adult prices). This meant that the RegEx steps didn't generate the full table correctly for those cities. I attempted editing my RegEx a few times to correct this, but still couldn't get the desired output. Again, due to the time constraints I had to further reduce my scope and leave this table out of the workflow.
User Stories and Sketches
Due to the unforeseen challenges and blockers in the web-scrape and data prep part of the project, I had to limit my sketch in order to have it complete in Power BI before the deadline.
I decided to centre my user stories around price and weather, based on the tables I had. The user stories I decided to go with are as follows:
As a backpacker
I want to decide which city to visit
I can see which city has the best weather
By comparing the temperature and precipitation for a given city in a each month
As a backpacker
I want to know which city to visit
I can see which city is affordable
By comparing the backpacking cost for each city to the average cost of a hotel
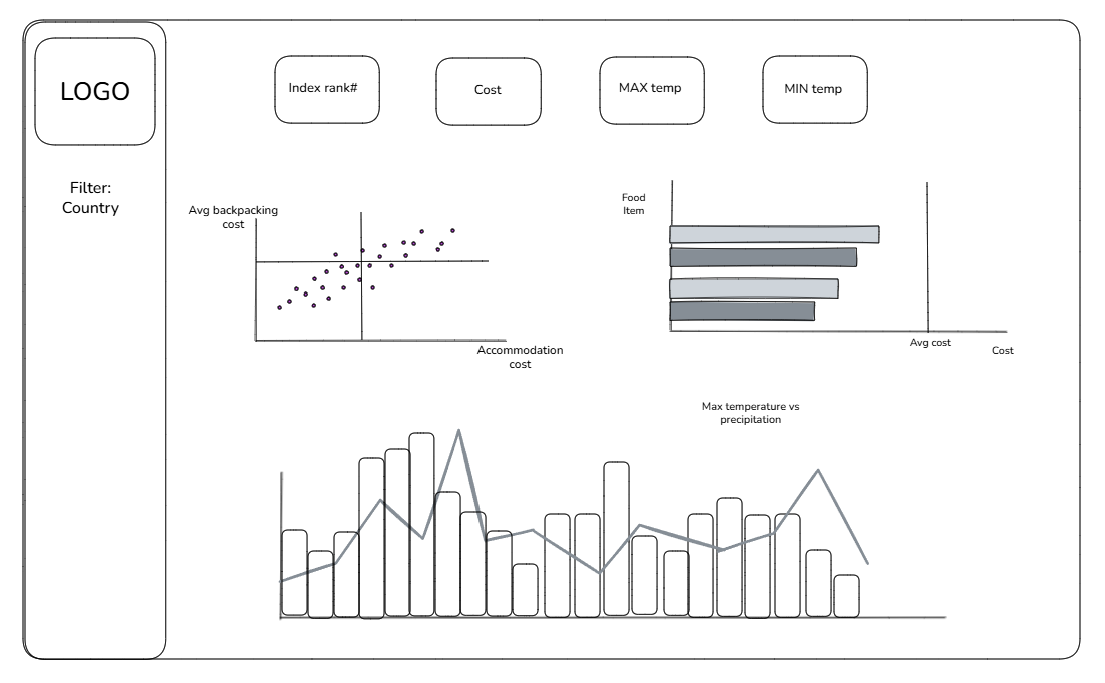
The image below shows the accompanying sketch I put together for the user stories.
The Final Step - Building Time
I input all the tables from my alteryx workflow into power BI, along with the Backpacker Index table that I initially pulled in power BI and began the fun part...building!
My final report by 3:15pm can be seen below. I was not able to get the image of the logo, so left a placeholder for this. I also struggled with getting the KPI for the index rank to show the correct value (upon reflection, this may be due to aggregation), but I opted to leave it out to avoid being misleading.