


Day 3 of my first week at the Data School — aka Day 2 of training — and we finally got hands-on with some real data!
After what felt like a whirlwind of introductions, learning about the role of a data consultant, and diving into data theory and preparation (all of which has been great, by the way!), it was super exciting to actually put what we’ve learned into practice. We’ve covered a lot of theory so far, so opening up Tableau Prep and applying some of those lessons felt like a big and satisfying step forward.
Tableau Prep can seem intimidating at first glance. But once you're taken through the basics — like how to navigate the interface and where to find key features — it starts to feel much more intuitive. In fact, it’s easy to start getting curious about what else you can do with it. That’s when it gets fun! To apply what we’d learned, we were given a few Preppin’ Data challenges. These are practical exercises designed to progressively build up your data prep skills. We started off with some lighter tasks to ease in, but I eventually hit a roadblock with one of the exercises: 2021 Week 2. The requirements for this task can be seen below.
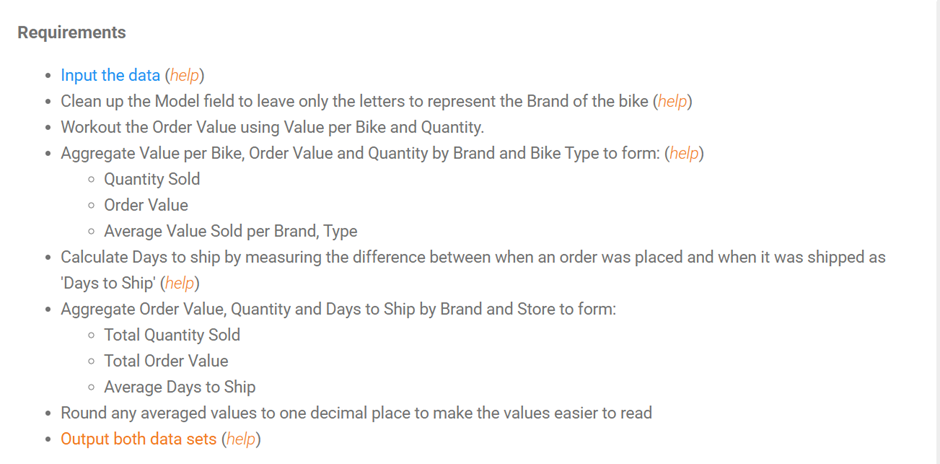
The task required us to calculate a ‘Days to Ship’ field, and later create an aggregation using this field along with some other fields. This part tripped me up at first — but that’s where the learning really began.
What I Learned
One of the biggest things I learned was how flexible Tableau Prep is. You can go back to any earlier Clean step in your flow to make changes — whether that's adding a calculated field, splitting a column, or pivoting data etc. Those changes then cascade through the rest of your flow.
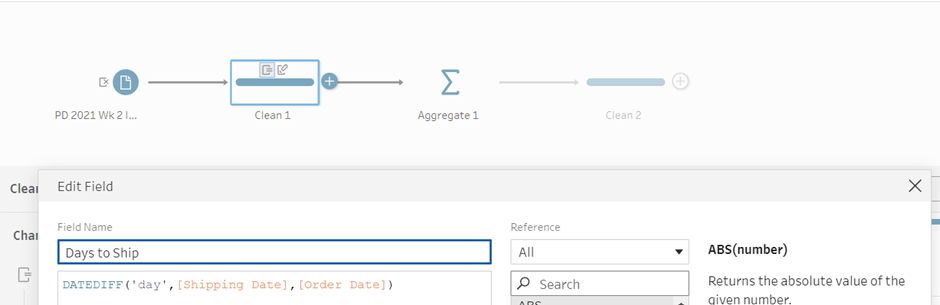
Once I understood that, the solution became clear. I went back to my Clean 1 step and created a calculated field for ‘Days to Ship’.
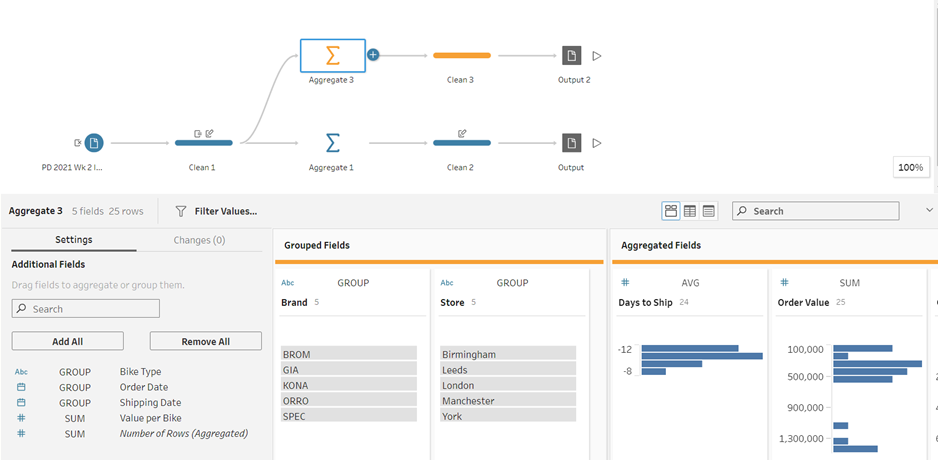
From there, I could apply the necessary aggregation steps to generate a second output, as required by the challenge.
My Top Tips & Key Takeaways for Data Prep
1. Plan, Plan, Plan!
This is the number one thing I’ve learned so far. Before diving into Tableau Prep (or any data tool), take a step back and understand your dataset:
- What do the fields mean?
- What is each row showing?
- What’s your end goal?
Once you’ve grasped the data structure, sketch out what you want your final output to look like. Ask yourself:
What will my data look like after joins, pivots, filters, calculated fields, etc.?
Having this visual plan or checklist makes it 10x easier to spot what transformations you’ll need to get from A to B.
2. Don’t Be Afraid to Iterate
It’s completely okay (and expected!) to go back and tweak steps in your flow. Tableau Prep is built for this kind of flexibility.