


For day three of our dashboard challenge, the focus was on analysing UK Street Crime data spanning from March 2024 to March 2025. The goal? To build a dynamic Alteryx app that empowers users to filter the data by a specific date range, crime category, and location—either through postcode or an interactive map. The final output would update a data source that feeds into a Tableau Server, Tableau Public (via Google Sheets), or a Power BI dashboard.
Planning the Day
To stay on track, I mapped out my schedule with dedicated time blocks for each task:
🕘 9:00–12:00 – Alteryx Flow
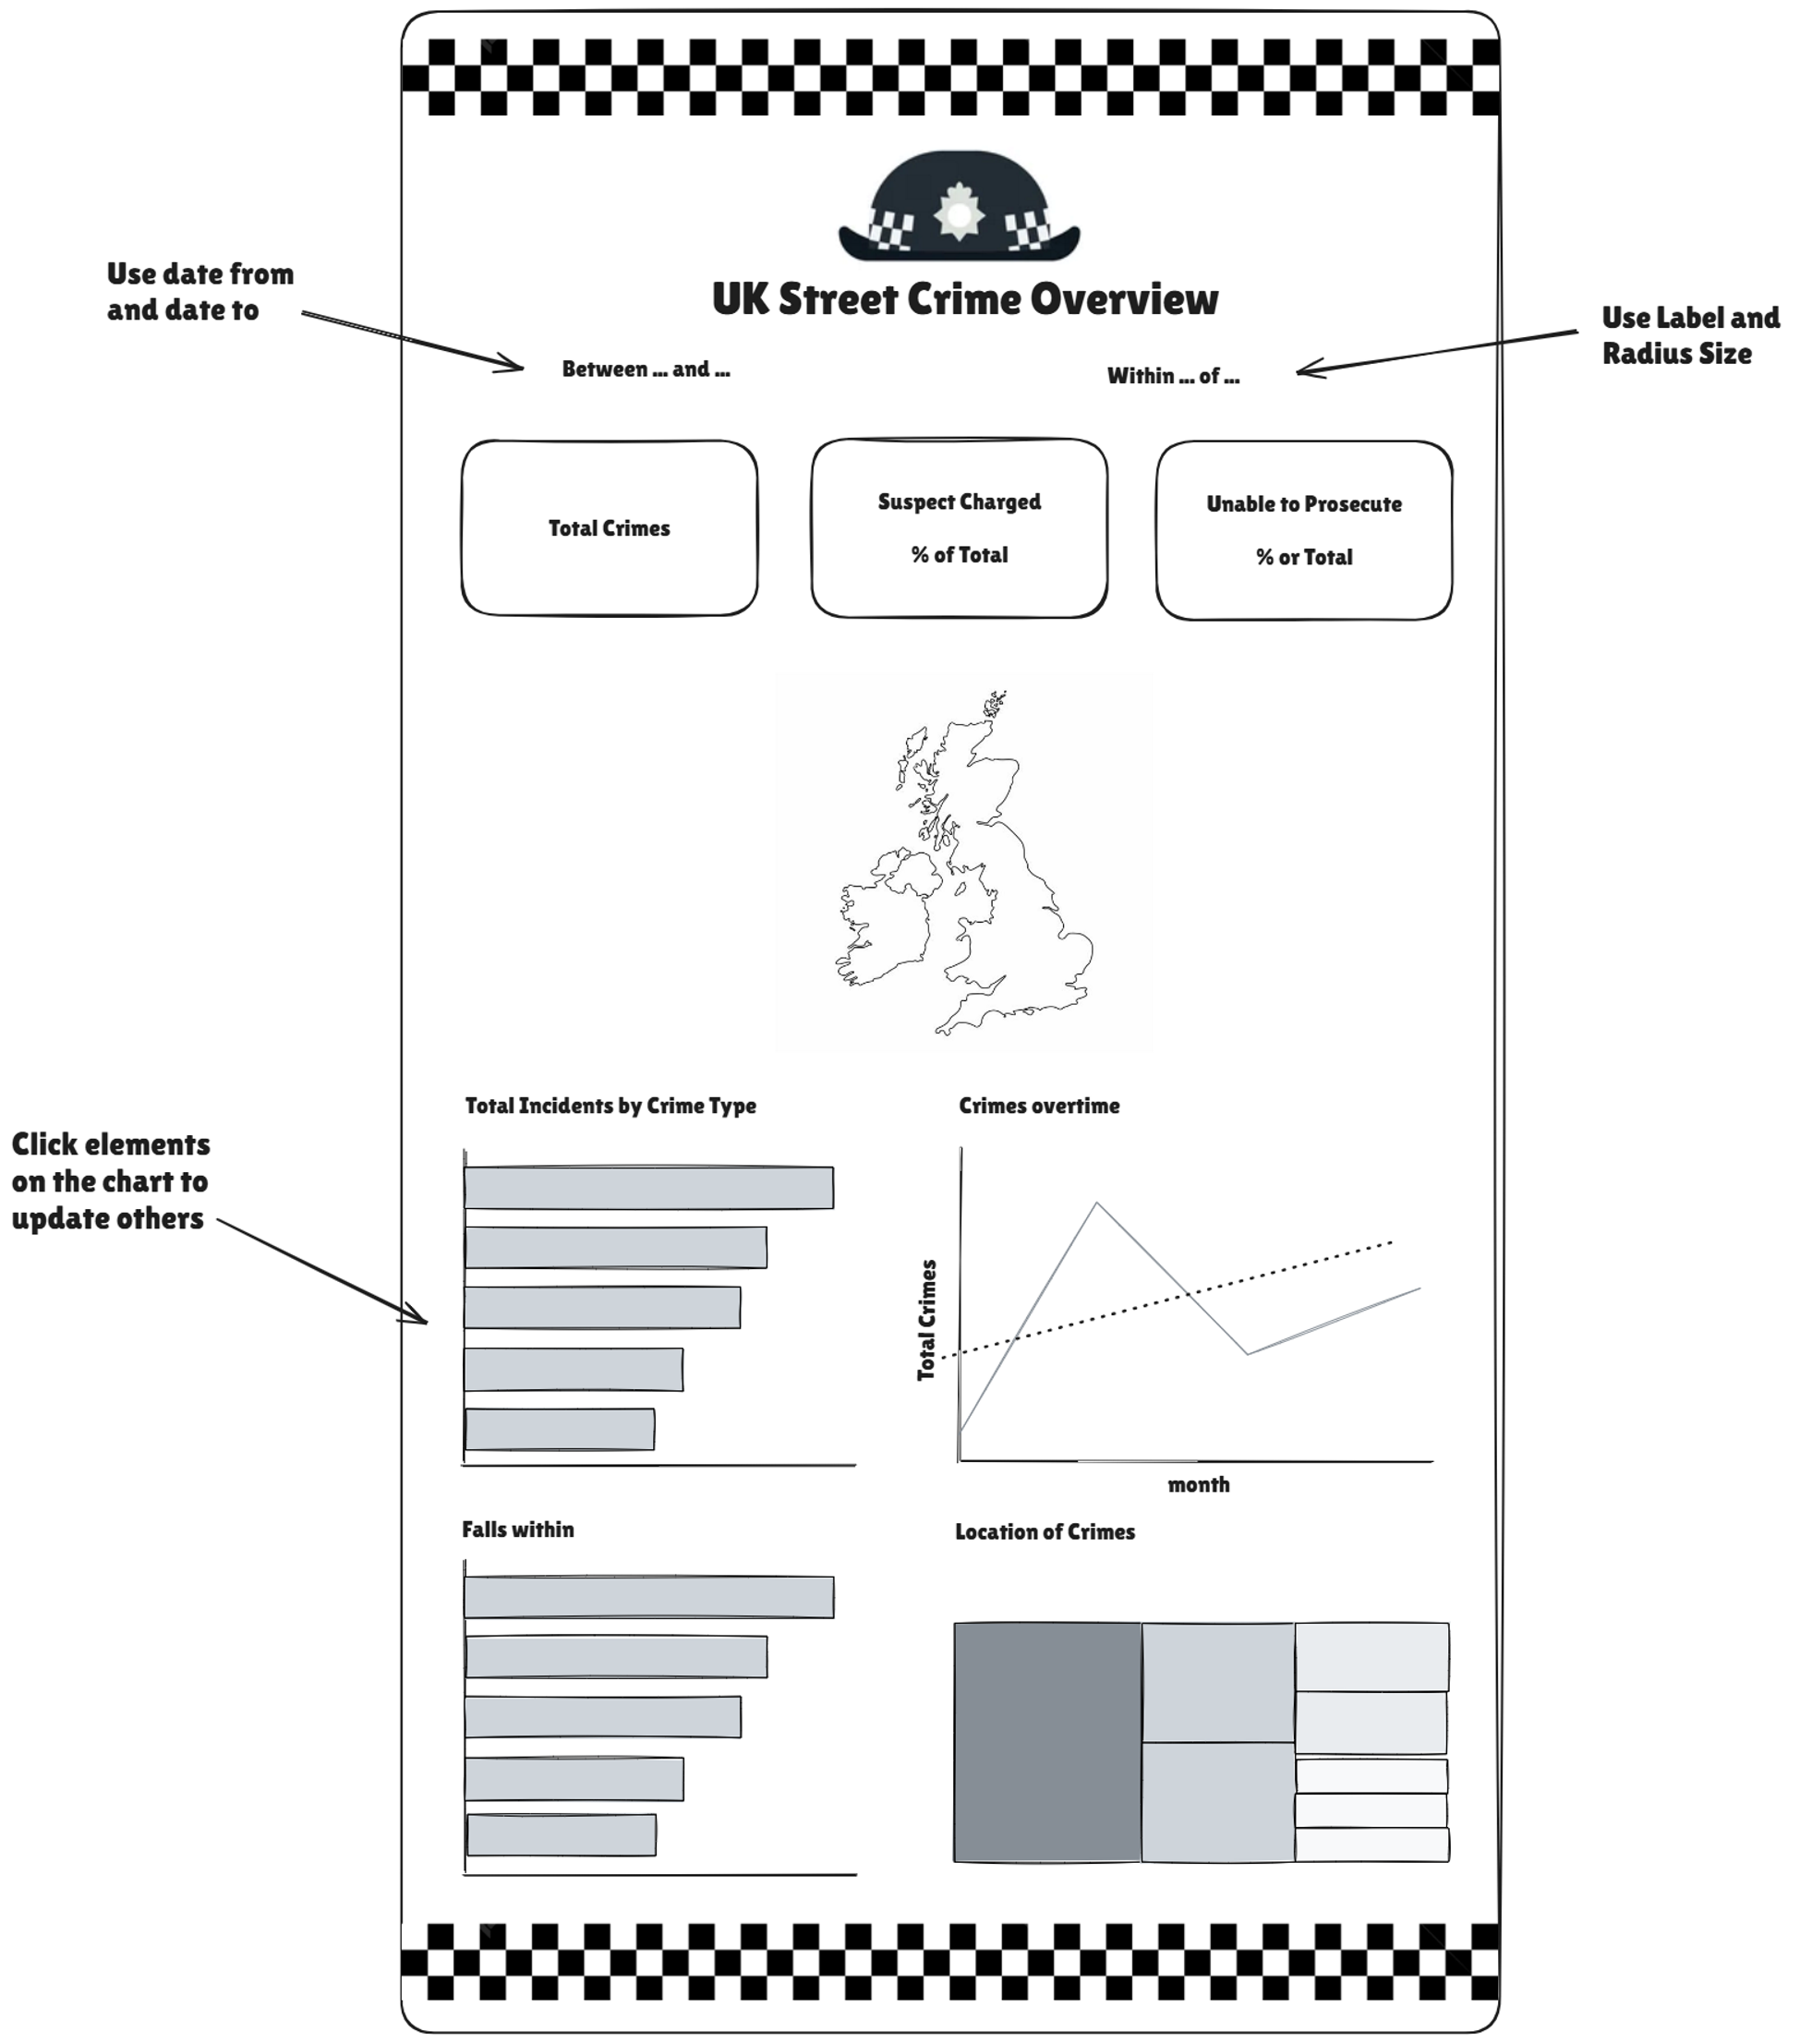
📝 12:00–12:45 – Sketch
🍽️ 12:45–13:15 – Lunch
📊 13:15–15:00 – Build in Tableau
🔧 15:00–15:30 – Final Touches & Rehearsal
While things mostly went to plan, feedback from the stakeholder led to significant changes in my Alteryx workflow. This meant I had to make edits post-lunch while continuing to sketch and troubleshoot a few issues with the Alteryx app's performance.
Steps I Took to Build the Alteryx App
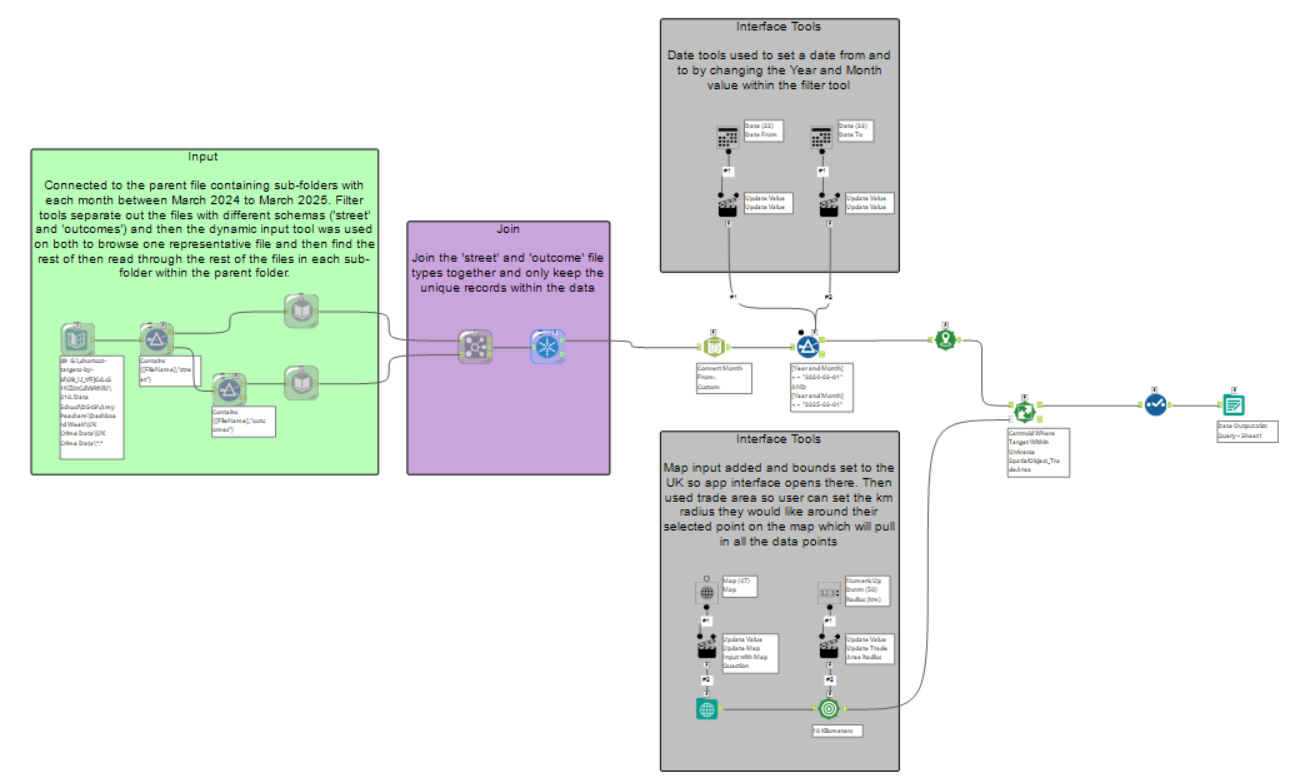
1. Dynamic File Input and Schema Handling
I started with a Directory Tool to locate the parent folder, which housed sub-folders by month. Each folder contained ‘street’ and ‘outcome’ datasets for various police forces. To manage schema differences, I used Filters to split ‘street’ and ‘outcome’ files and then applied Dynamic Input Tools. These referenced one sample file per type to define the schema, then imported the rest.
2. Joining and Cleaning Data
Next, I used a Join Tool to combine ‘street’ and ‘outcome’ data on common fields. A Unique Tool helped eliminate duplicate Crime IDs to clean up the dataset before app creation.
3. Date Filtering for User Input
Before incorporating interface tools, I converted the ‘Month’ field into a true date format. This allowed me to use a Date Interface Tool and apply filters like:
[Year and Month] >= "2024-03-01"
AND
[Year and Month] <= "2025-03-01"
4. Geographic Filtering with Map Input
To allow spatial filtering, I used the Make Point Tool to convert latitude and longitude into spatial points. This was connected to a Centroid Tool and a Map Interface Tool, enabling users to click a location on a map and define a radius of interest via a Trade Area Tool. This spatial filter then isolated crimes within the specified distance.
5. Data Cleanup and Export
I refined the column headers using a Select Tool, then exported the cleaned data to a Google Drive-linked .xlsx file. This allowed Tableau Public to connect via the “Connect to Google Drive” option.
If I’d had more time, I would’ve explored using Alteryx’s native Tableau Server or Google Sheets add-ons for a more seamless integration—but for today, the Google Drive export did the job.
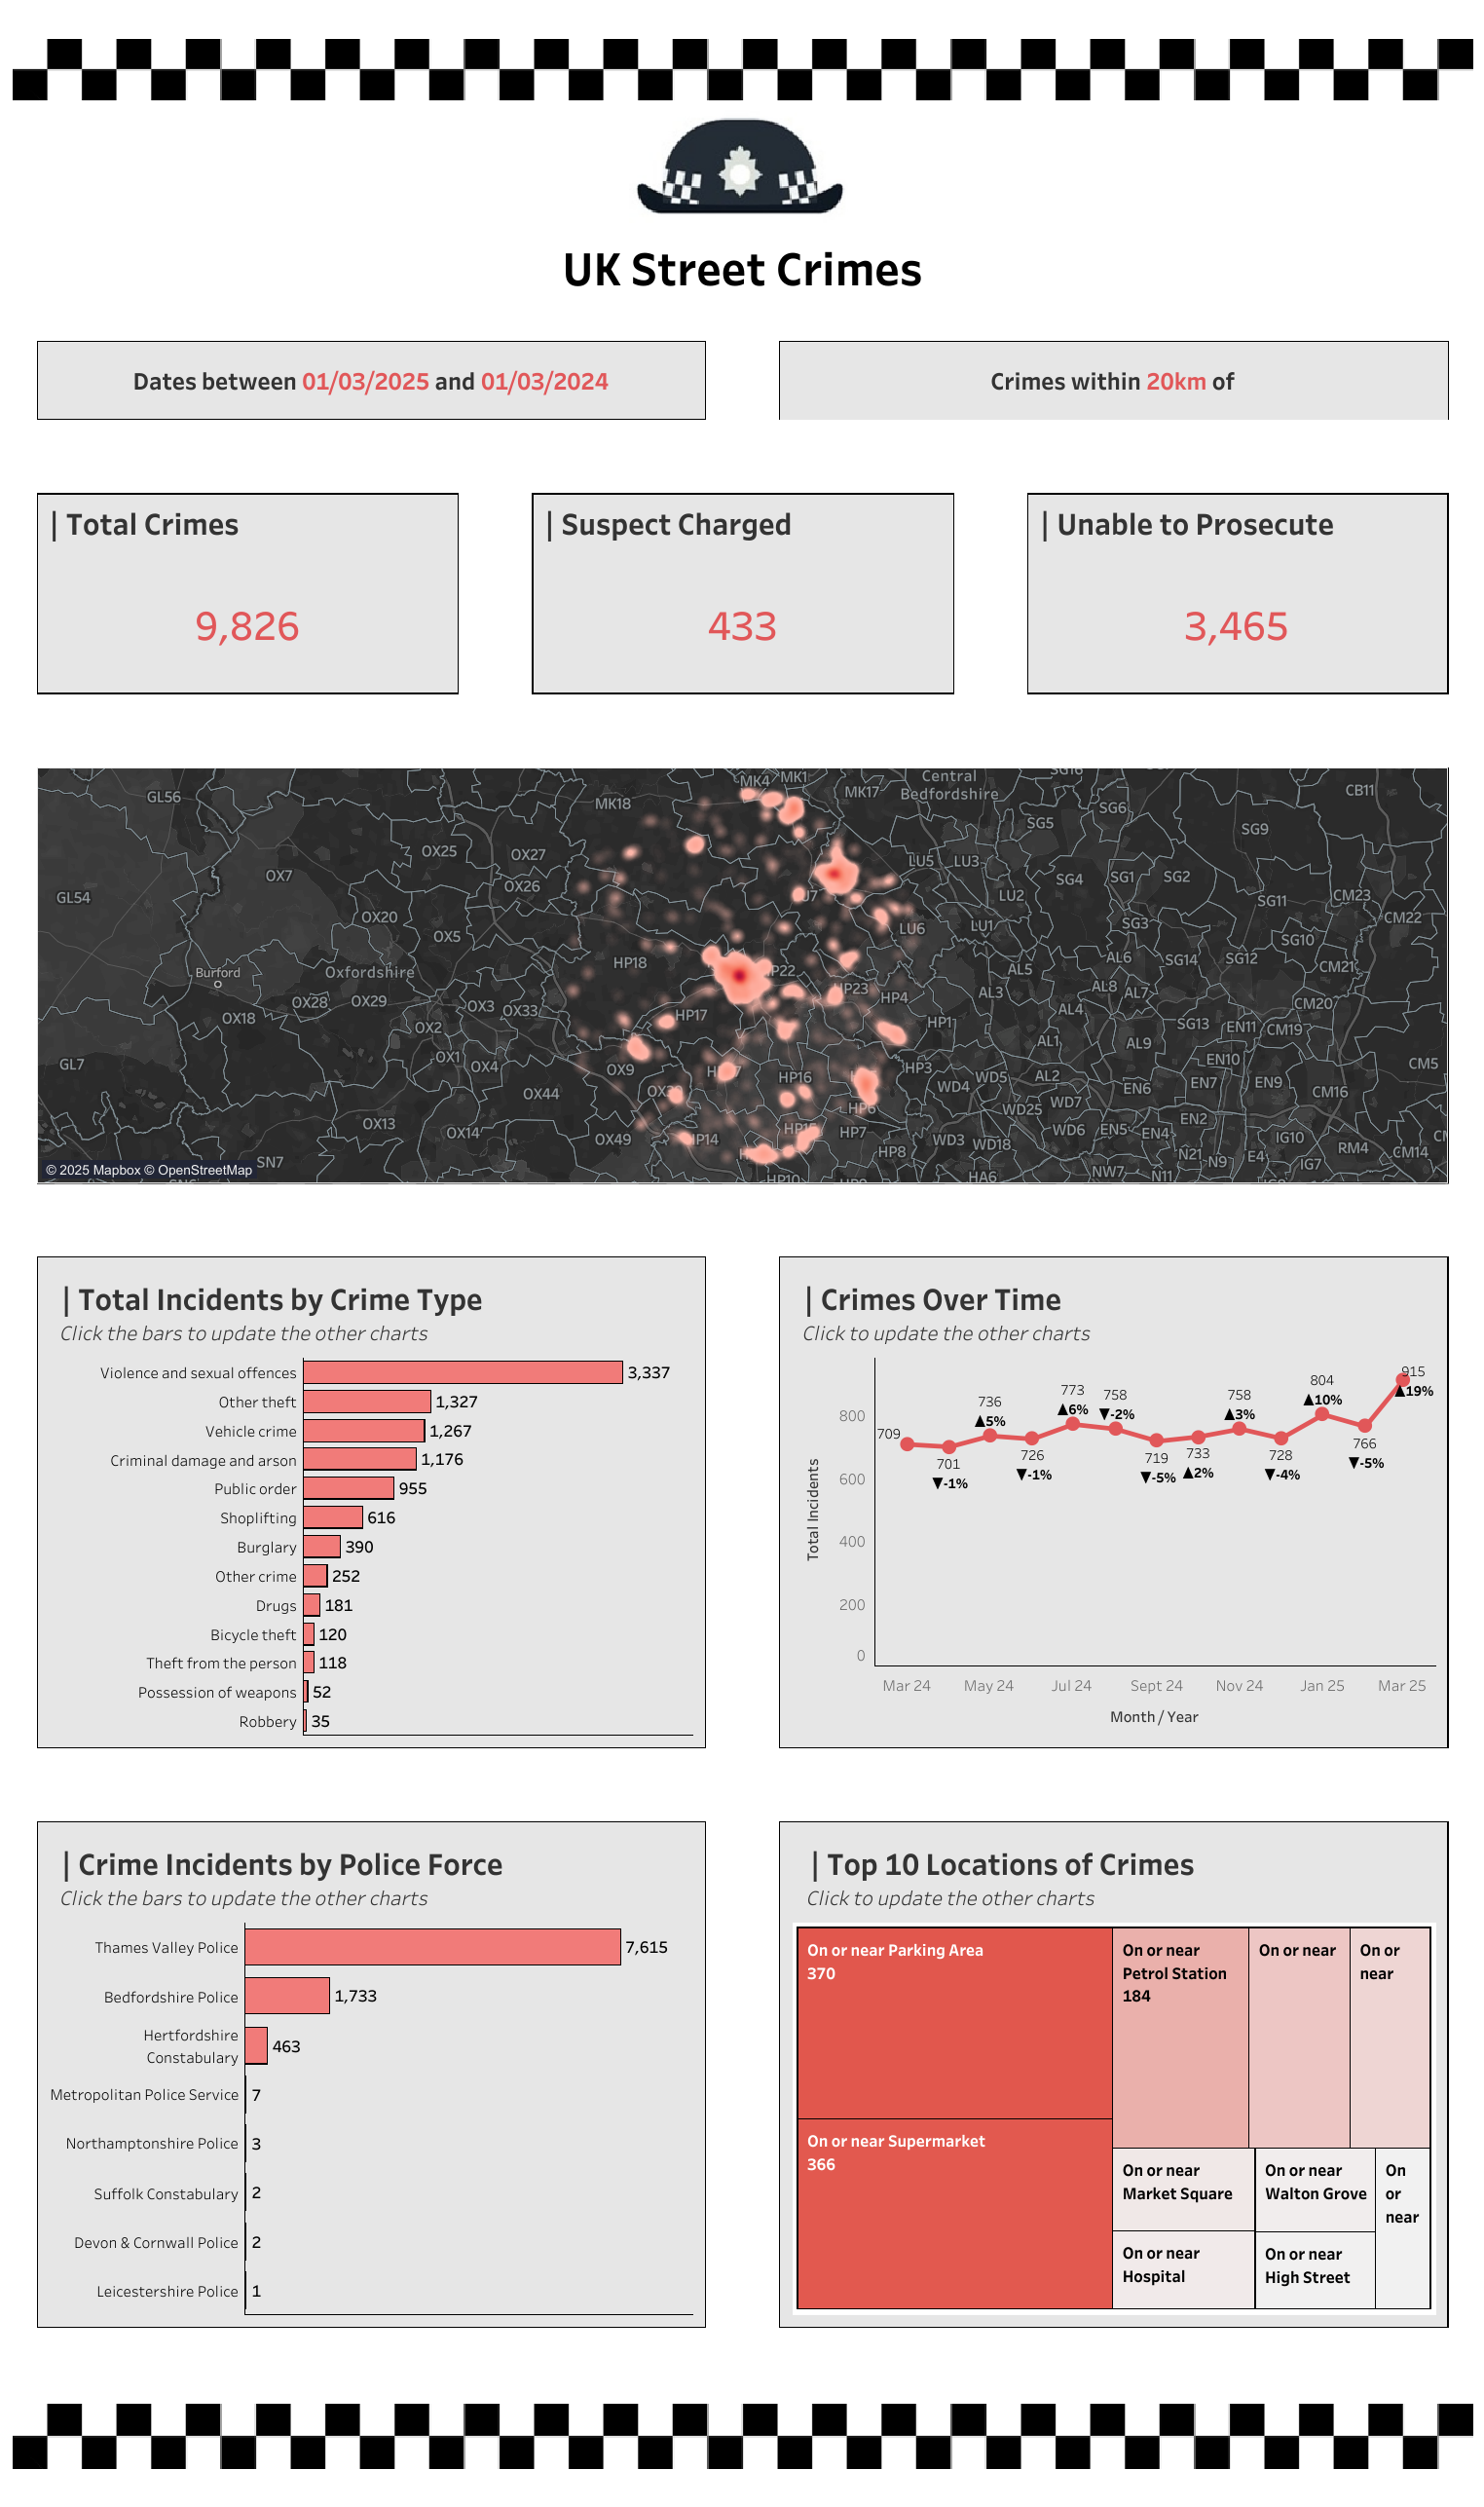
Once I had more workflow working I could then get to work building a KPI dashboard in Tableau. I utilised the sketch I made earlier on in the day when putting this together and this was what I can up with:
Reflection
This challenge offered a valuable opportunity to combine Alteryx app-building with geospatial tools and interface design. While there were a few setbacks along the way, I’m pleased to have delivered a functional app. That said, I would need to further explore options around the output tool—specifically whether using the Alteryx Server or Google Drive add-ons might offer more robust alternatives.