


For Dashboard Day 4, we were tasked with creating a dashboard around one of Robbin's favourite video games, 'Path or Exile'. So to begin this challenge I first needed to do some research on what this game was all about.
Research
The game is a free-to-play online action role-playing game (ARPG) developed and published by Grinding Gear Games, a New Zealand-based studio. The game was officially released in October 2013 and has since received multiple expansions and seasonal updates called leagues. Leagues (Seasons) introduce new mechanics and rewards every few months, often influencing the core game if popular. The game has an item-Based Economy where there's no gold — instead, players trade using currency items like Orbs that also modify equipment.
🪙 Currency System
Path of Exile has no gold or central currency. Instead, it uses a barter-based system where different items are used as currency.
- The most commonly traded currency items include:
- Chaos Orb: Often used as a standard for trade pricing.
- Exalted Orb: Very rare, high-value currency.
- Armourer’s Scrap: Used to improve the quality of armour.
Many others, each with a functional in-game use.
📦 Items
Items have many layers of complexity, including:
- Type: Weapon, armour, flask, etc.
- Base Type: The underlying item base (e.g., "Nailed Fist" is a base claw weapon).
- Rarity: Normal (white), Magic (blue), Rare (yellow), Unique (orange).
- Name: Especially important for Unique items.
- Variants: Some items have different versions depending on the league or patch.
- Links: Items can have linked sockets for combining abilities; more links = higher value.
Alteryx
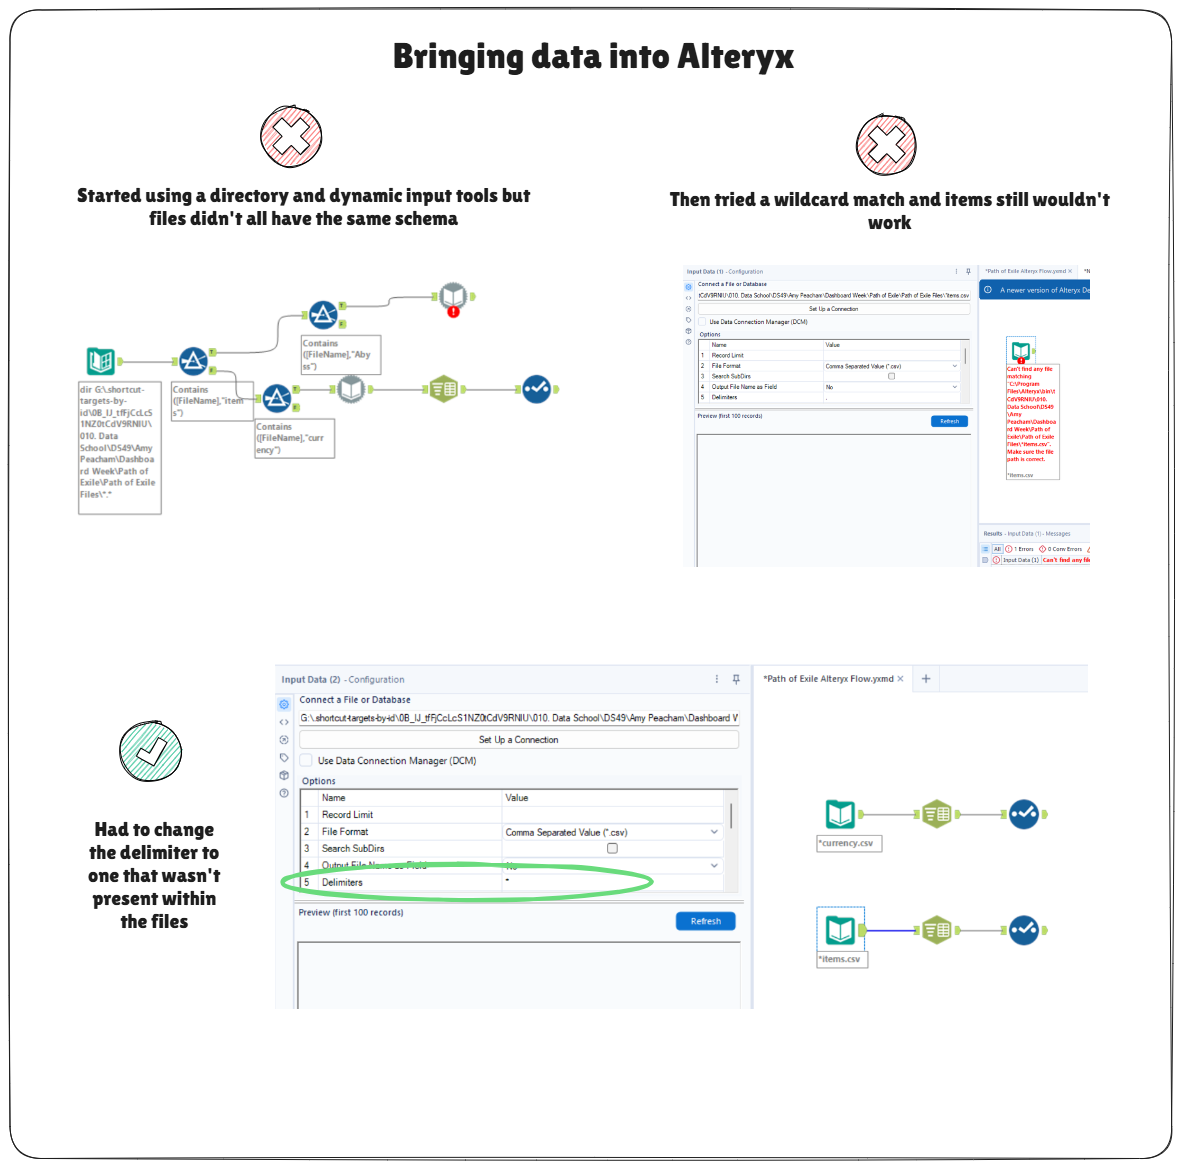
Once I had conducted a bit of research I started downloading the league files and going through each one to only keep those with the folder name and items.csv and currency.csv. I then headed into Alteryx to bring all of these files into one table for both items and currency. To begin with I attempted to use the same method as I did yesterday with the use of a directory tool which would search through each league subfolder, then used filter tools to separate out file names with items and currency. However when adding the dynamic input tools in after, currency had no errors but one kept consistently appearing for the items data. I then pivoted to moving all the files into one folder (removing the subfolders) and using a wildcard match in a regular input tool, but this also threw out the same error. In the end I found out that the delimiter in the input tool needed to be changed to a character that was not present within the data in order for this to work so I simply changed it from a default ',' to a '*' and this then worked.
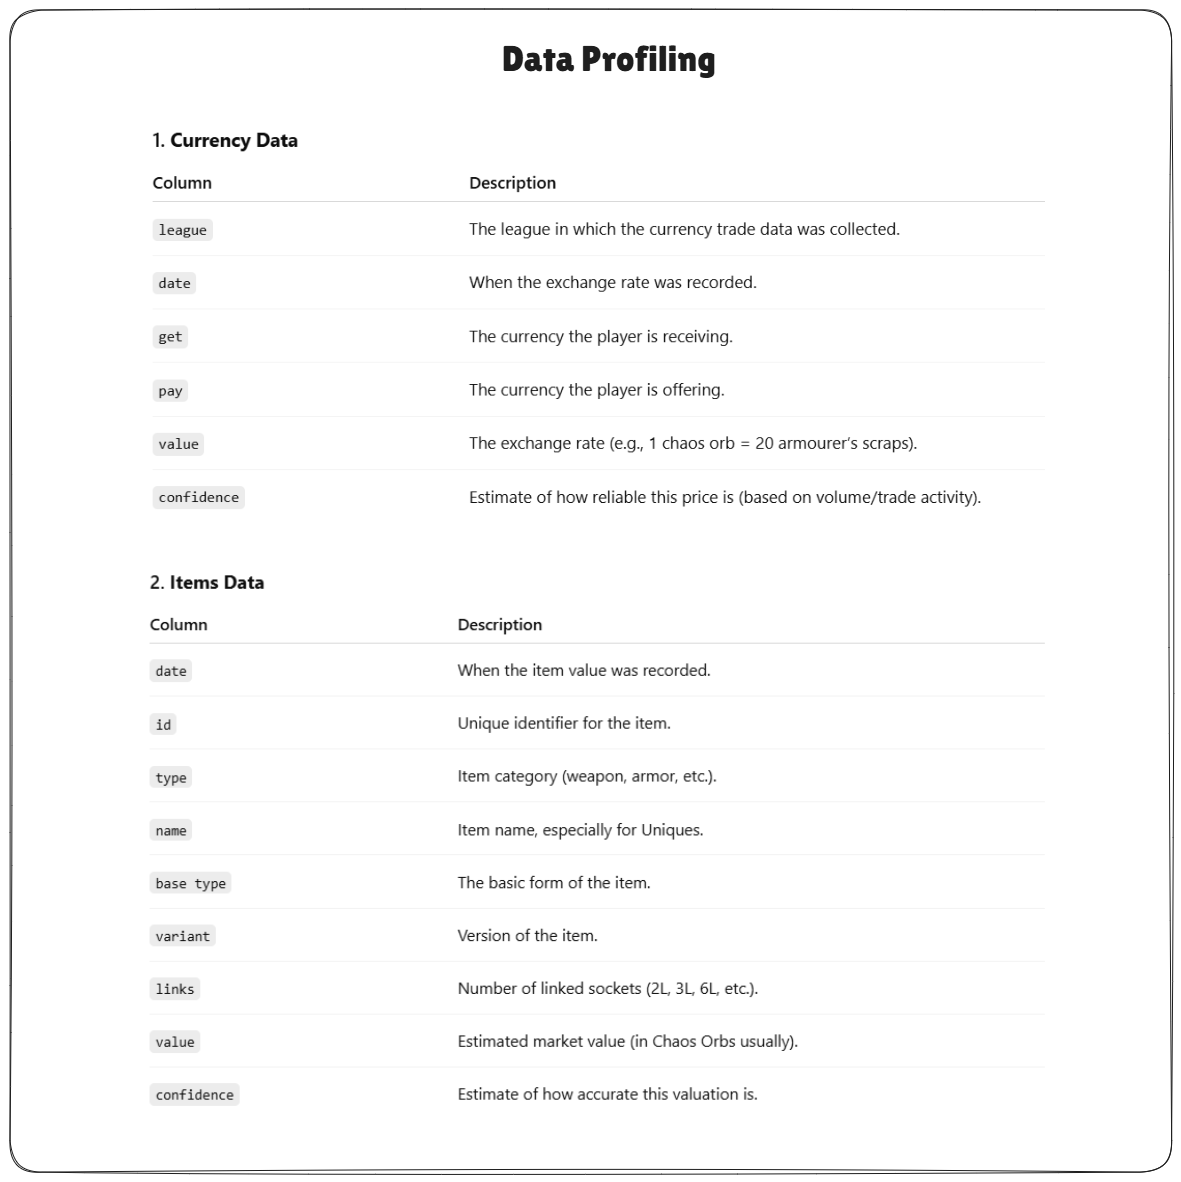
Data Profiling
After pulling the data into hyper files ready to use in Tableau, I decided to do a bit of profiling around what fields were actually present for me to utilise.
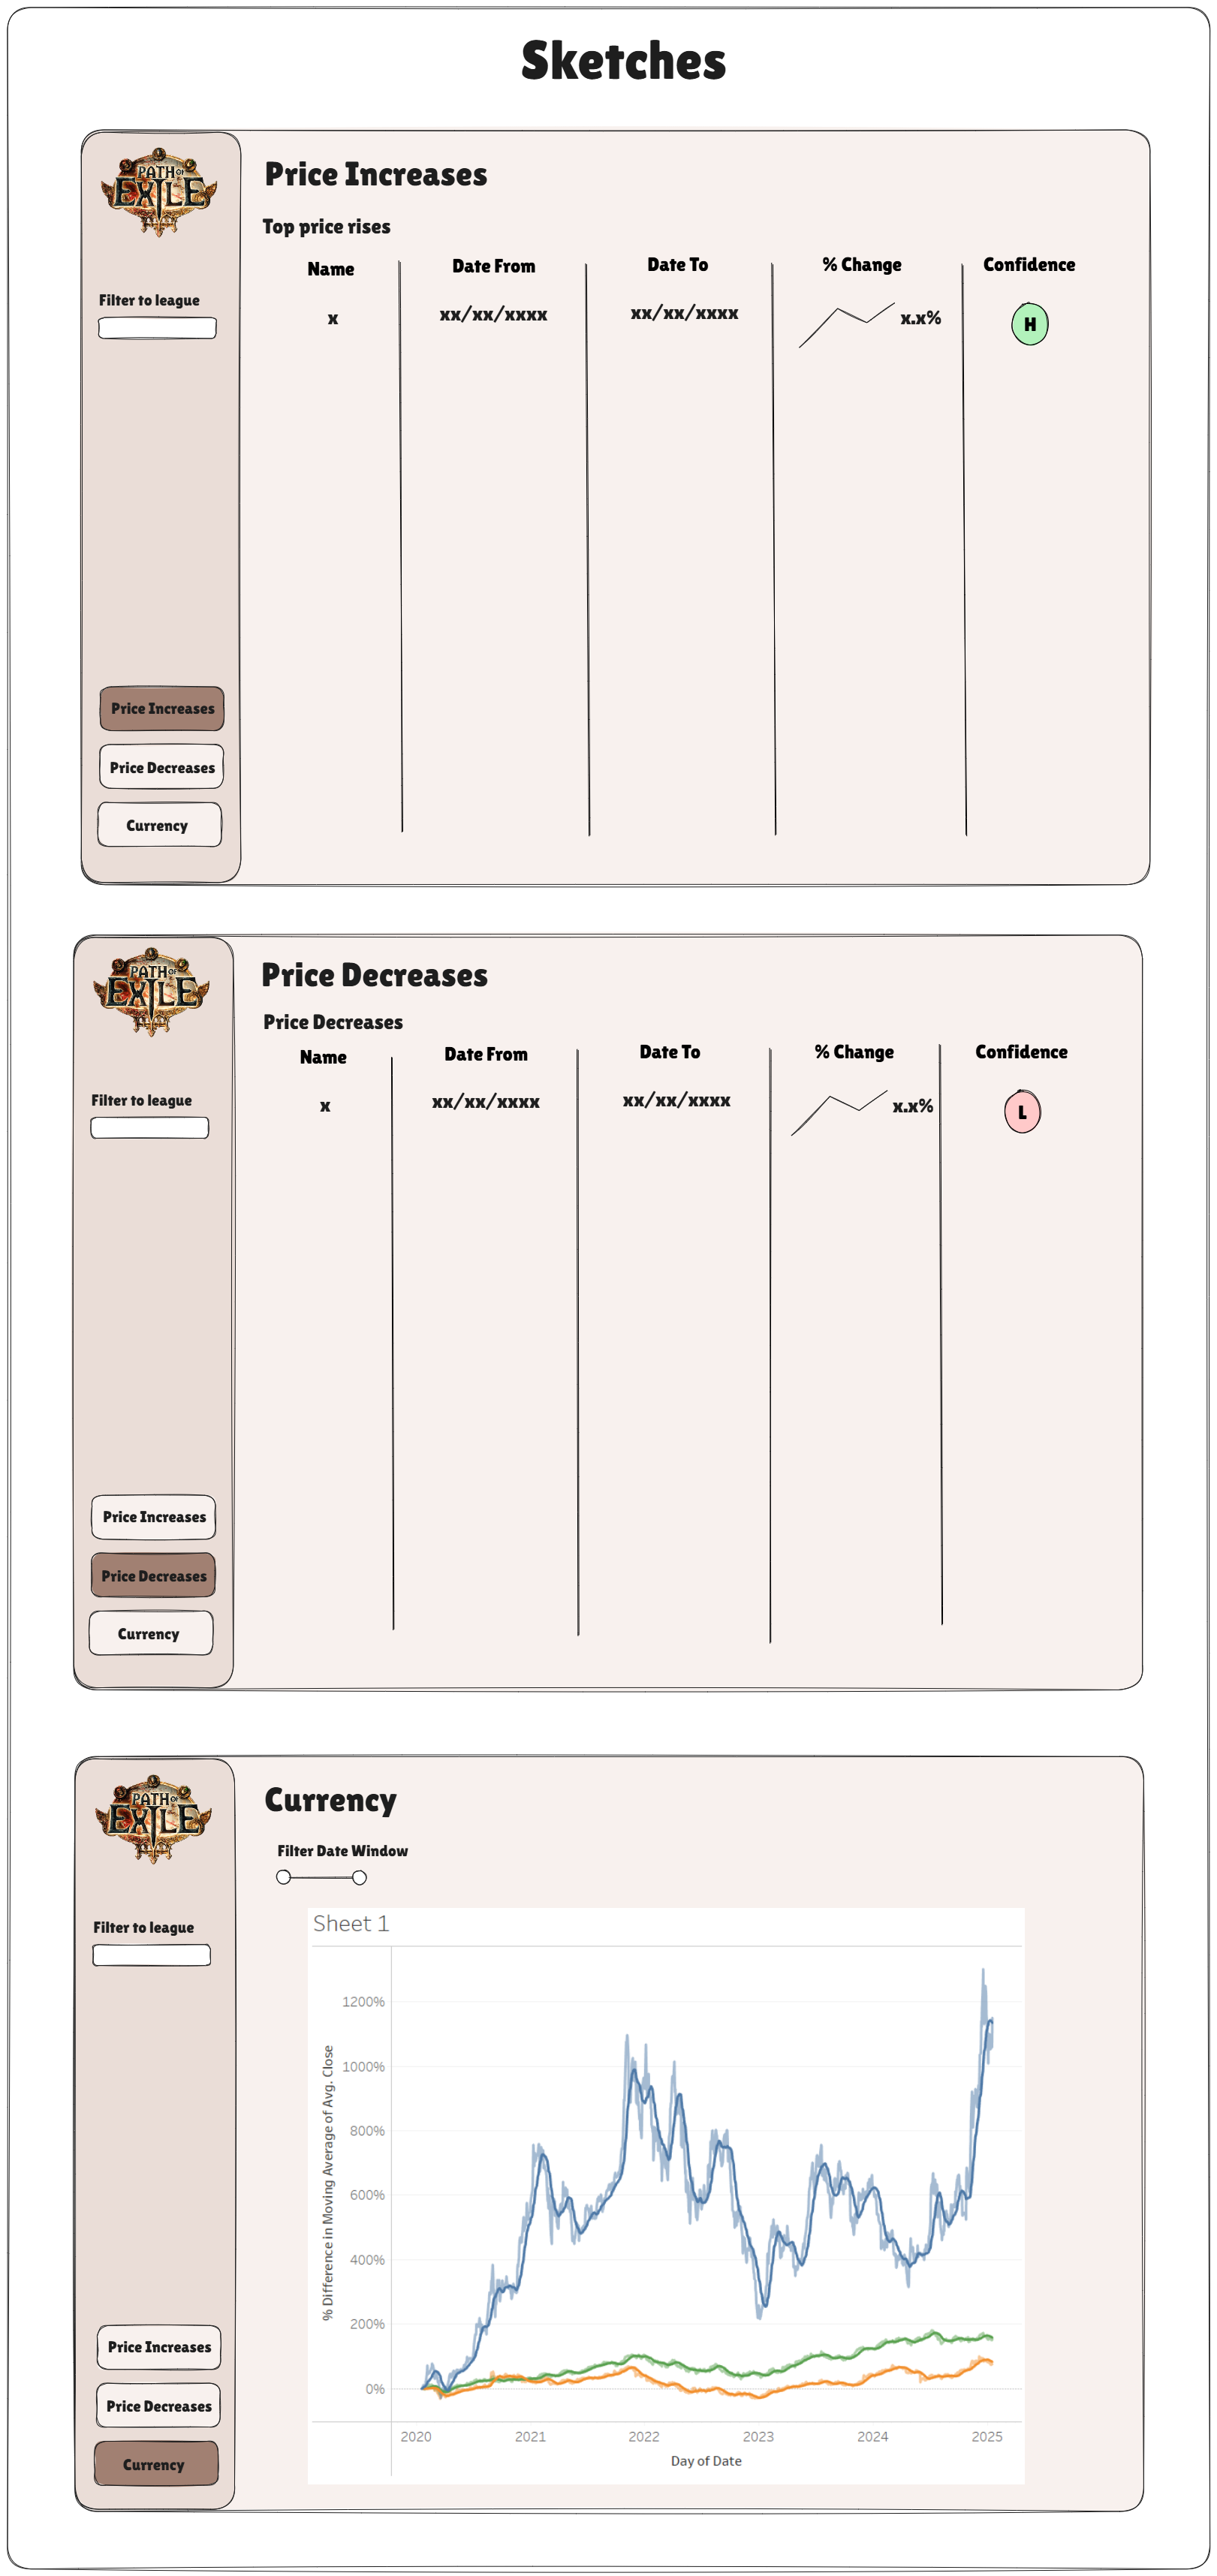
Once I had finished this I was already quite pressed for time so I started panicking quite a bit when it came to user stories as I couldn’t come up with what I wanted to focus the dashboard on. Eventually I came up with two overarching use cases to help me come up with some sketches for the dashboard:
For the items data set:
"As a player I want to identify the top price rises and falls to understand which items I should sell to make a profit"
For the currency data set:
"As a player I want to understand which trends in currencies within a specific league and see their volatility over time"
When designing my dashboard I took inspiration from poe.ninja table which gave an overview of items within the game and also Price Falls - RuneScape - Grand Exchange which has provides a summary of data from a game similar to this one. I also remembered a session from the beginning of training where we had built a table showing the moving average of shares over time and thought this may be a useful way to display the different currencies in the game and their values over time. These were the sketches I came up with:
However when it actually came to building these in Tableau I faced so many issues with loading time of the extracts and also with building the tables in the correct format and getting a rank to work to show top and bottom items which stopped me from fully building these dashboards. I should have limited the amount of data I downloaded to a few leagues so it was easier to deal with in Tableau. I also should have gone to our stakeholder sooner to ask what my specific user stories should be as I spent far too long trying to work out what to do as I was not a user of this game. Unfortunately today didn't go the way I wanted it to but it has taught me a lot about how I need to limit my scope a lot more so it's manageable in the time I have and also try not to panic when things don't work or I don't fully understand what data I'm dealing with. I am very disappointed with what I managed to achieve today and the pressure got to me a lot (seems to be a common theme this week) but hopefully I will have a lot more success with Dashboard Day 5 (our final day!!).