


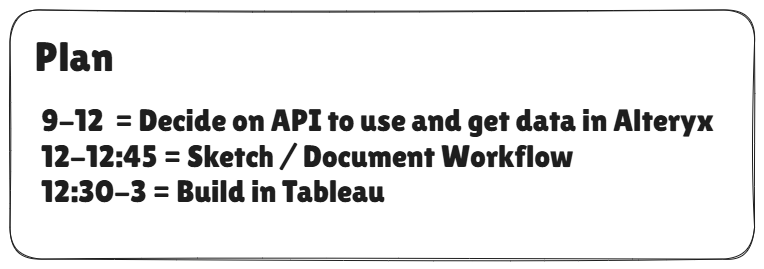
Our final day of Dashboard Week focused on exploring NASA's open APIs. We were given the freedom to choose any API from their website and tasked with building a workflow in Alteryx to convert the data into a usable format, followed by designing a Tableau Dashboard. I started by creating a plan for the day — and I’m pleased to say I stuck to it:
I jumped straight into Alteryx and began building a flow using the NeoWs (Near Earth Object Web Service) API, which provides information about near-Earth asteroids. I began by reviewing the API documentation to understand how it worked:
"NeoWs (Near Earth Object Web Service) is a RESTful web service for near Earth asteroid information. With NeoWs, a user can: search for asteroids based on their closest approach date to Earth, look up a specific asteroid by its NASA JPL small body ID, and browse the overall dataset."
Query Parameters:
- Start_date
- End_date
- API_key
*Can only send a request for one week of data at a time — so multiple input tools are needed to fetch data for additional weeks.
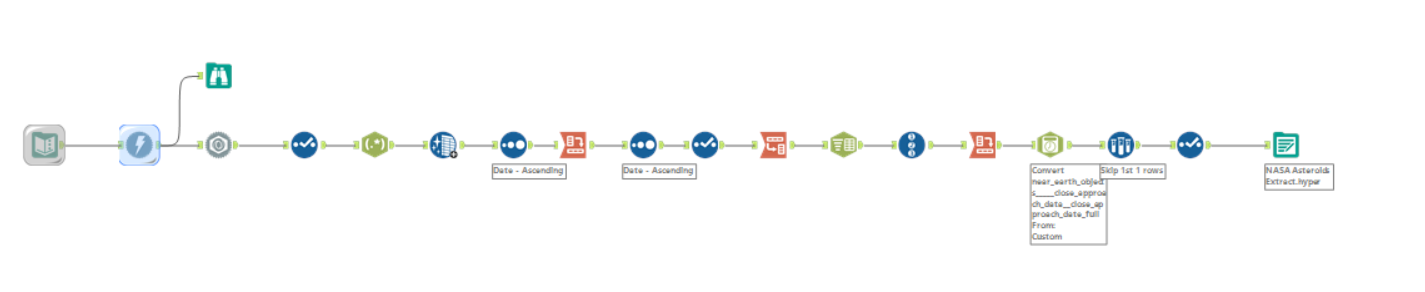
Initially, I had to spend some time reacquainting myself with the workflow-building process in Alteryx, but once I got going, everything fell into place, and I was able to build the flow faster than expected.
With the data in hand, I moved on to sketching and planning my dashboard in Tableau. I had a feeling that we might be working with the NASA APIs after Robbin hinted that we would be using space data, so I’d already browsed Tableau Public to see how others had visualised similar datasets. I drew inspiration from a few different workbooks and quickly sketched out an idea, so I could jump straight into building — especially since the main chart was one I hadn’t created before and I knew it might take some time.
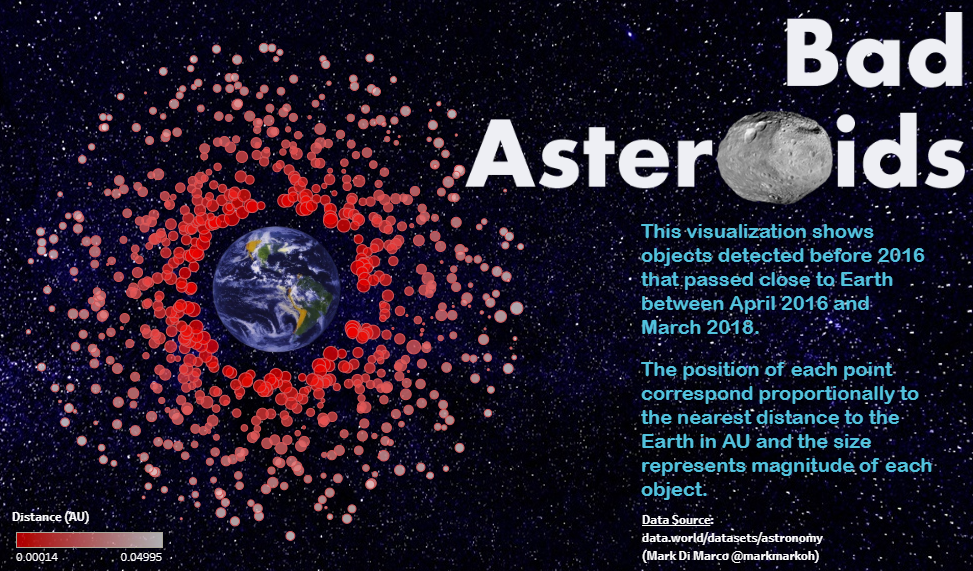
https://public.tableau.com/views/NearMisses/Dashboard1?:language=en-GB&:sid=&:redirect=auth&:display_count=n&:origin=viz_share_linkhttps://public.tableau.com/views/AsteroidstoEarth/AsteroidsHeadingToEarth?:language=en-GB&:sid=&:redirect=auth&:display_count=n&:origin=viz_share_link
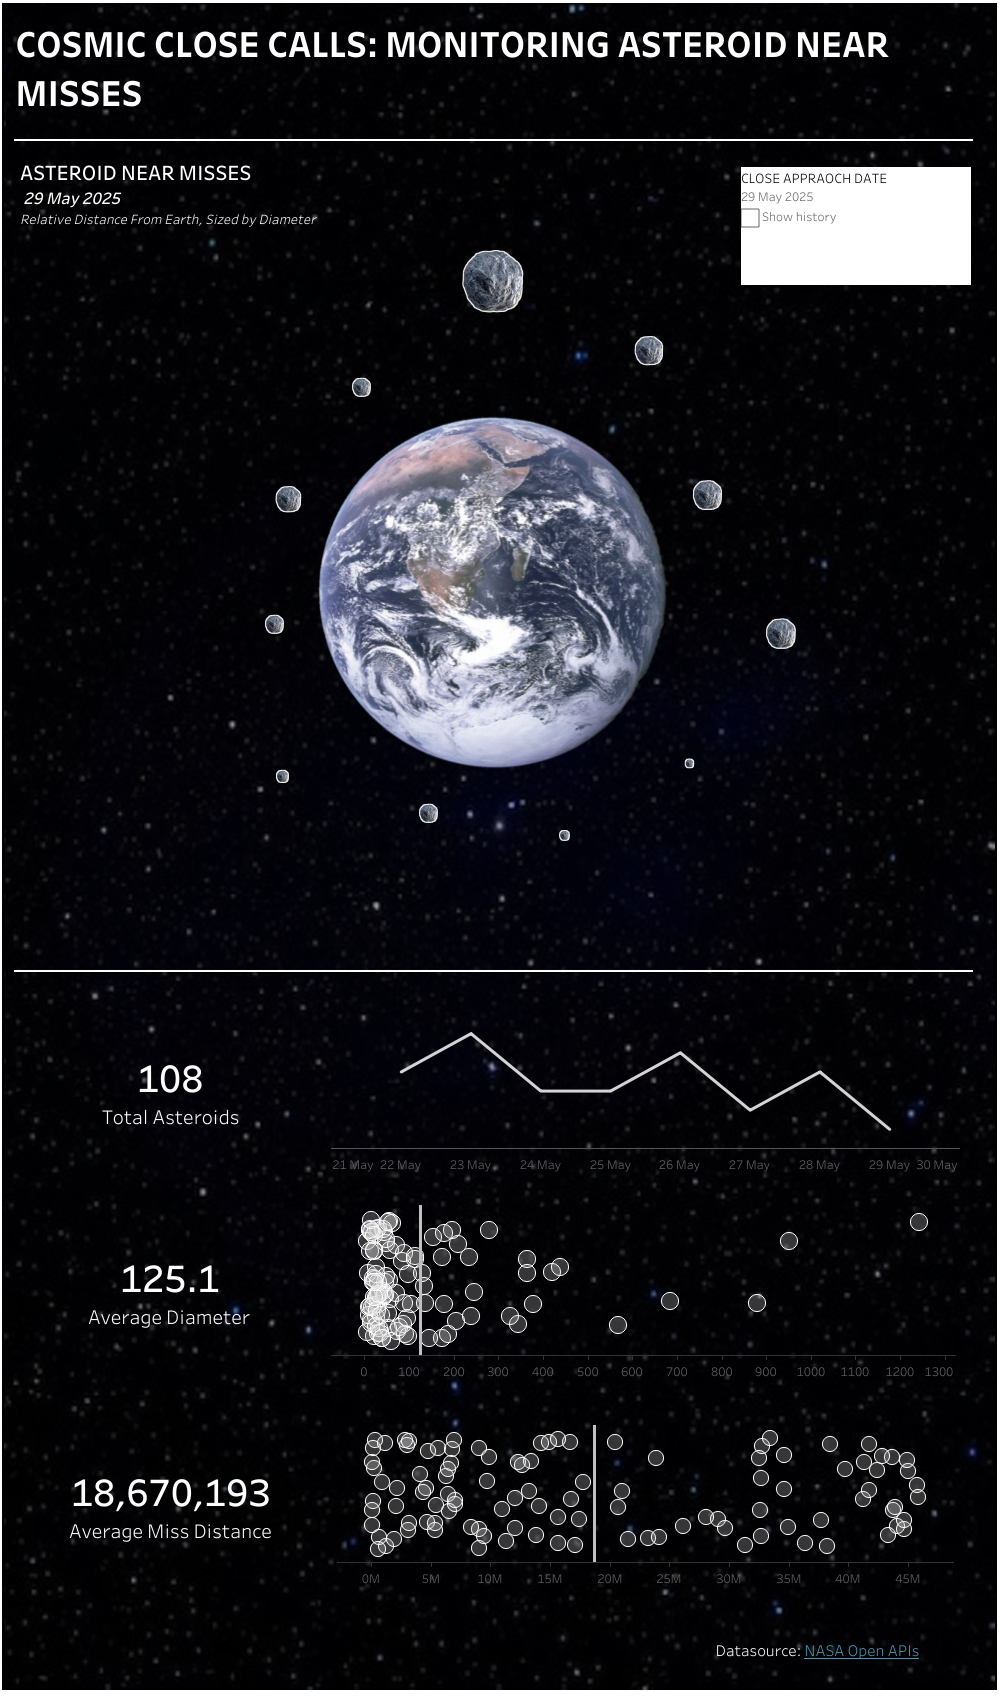
I’m really pleased with how closely I was able to replicate the charts I’d seen, especially considering I only had the afternoon to build the dashboard. Overall, I’m very happy with the final result:
Looking ahead, here are a few potential next steps I could explore:
- Make additional API calls in Alteryx
- Add colour coding to asteroids to indicate hazard level
- Improve interactivity so only asteroids from a specific day are shown — possibly using the Pages tool as a filter?