


This week at The Data School, we've been diving into data preparation techniques in Tableau Prep, including scaffolding, ranks, and Level of Detail (LOD) calculations. These methods can enhance data structuring, analysis, and reporting. Here’s a breakdown of these key concepts and how we applied them in a real-world challenge.
What are Ranks?
Ranks are a way to assign a numerical position to each row in a dataset based on a specific order. Some options of these in Prep are:
• Rank = assigns a unique rank to each row based on a given field, skipping numbers when there are ties.
• Rank dense = similar to Rank, but it does not skip numbers when ties occur.
• Rank percentile = assigns a percentile ranking (0 to 1) based on the position of a value within a dataset.
What are LODs?
Level of detail (LOD) calculations allow you to analyse data and answer questions involving multiple levels of granularity. Unlike normal aggregations that group data, Fixed LODs retain the original row-level details while adding an aggregated value.
What is scaffolding?
Scaffolding is a data preparation technique used to create a structured dataset that ensures all expected data points exist, even if some values are missing in the raw data. This is especially useful when working with time series where gaps in data limit or could cause incorrect analysis.
Putting these to practice in Tableau Prep
To put these concepts into practice, we tackled the Preppin’ Data 2022 Week 32 challenge, helping Chin & Beard Suds Co. (C&BSCo) analyse their store mortgage data to answer:
- How much is still to be paid off for each store’s mortgage?
- How much remains to be paid off for all mortgages?
Step 1: Input the data
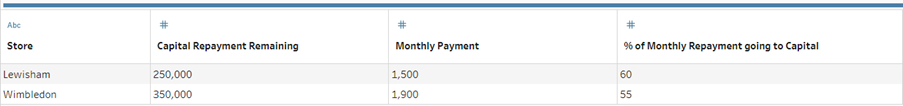
The first step was to bring in the store mortgages CSV file. Adding an initial clean step named “View” allowed us to quickly inspect the dataset. The dataset was small, containing only three rows (including headers) and four columns.
Step 2: Add a today date field.
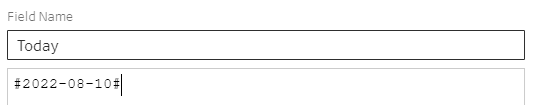
In a new clean step, we created a calculated field called “Today”, setting it to August 10, 2022 (the release date of the challenge). We used the following calculation to ensure the data type was recognised as a date:
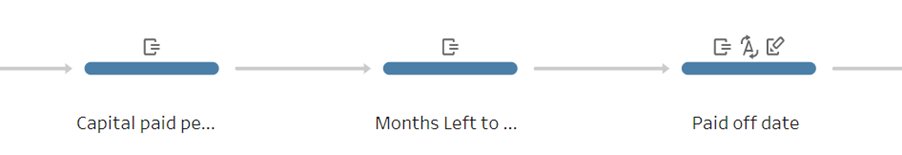
Step 3: Calculating capital paid per month, months left to pay and paid off date
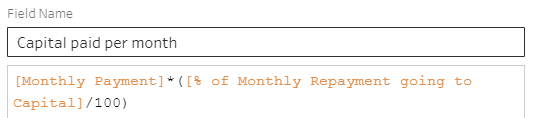
The first part of this section of the workflow was to add a calculated field for the capital paid per month which involved multiplying the monthly payments by the percentage of those payments that goes towards capital but dividing this percentage by 100 as it was not displayed as a decimal within the data.
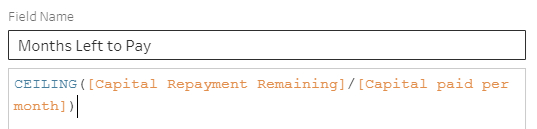
The next calculation that was needed to answer the questions from C&BSCo was months left to pay where capital repayment remaining needed to be divided by capital paid per month. Then to display this value as a representation of the whole month rather than a partial month, this would be wrapped within the CEILING() function which rounds each number up to a whole number.
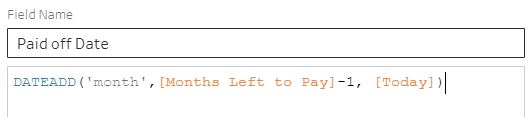
Finally, we needed to find the date that the mortgage would be paid off which could be achieved through the DATEADD() function. By specifying ‘month’ at the start of the function we can add the number of months left to pay which was calculated at the previous step (with -1 next to it as we already have a row for the first mortgage payment on the Today date) and then specify at the end that we want this to be added to the Today date field.
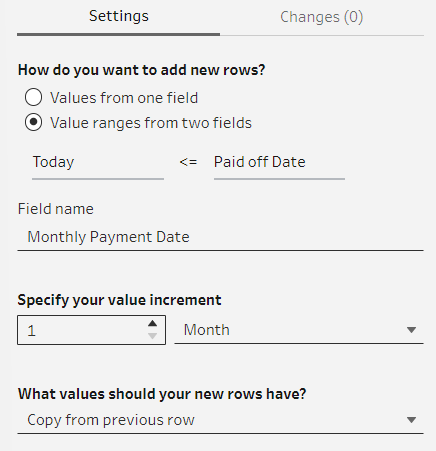
Step 4: Scaffolding
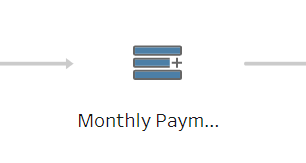
This is where scaffolding comes into play. In Tableau Prep, scaffolding is achieved using the “New Rows” step. Prep prompts: “How do you want to add new rows?” with two options:
• Values from one field
• Value ranges from two fields
For this challenge, we selected “Value ranges from two fields”, using Today and Paid-Off Date as the reference points. We set the increment to monthly, creating a new field called “Monthly Payment Date”. When asked “What values should your new rows have?”, we selected “Copy from previous row” to ensure the data remained structured.
Step 5: Rank the monthly payment date ascending group by store
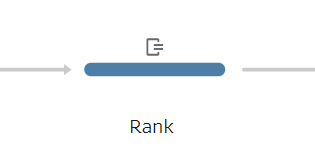
The first part of this step is to create a rank based on the monthly payment date and grouping this by each store to give a “Payment Order” column.
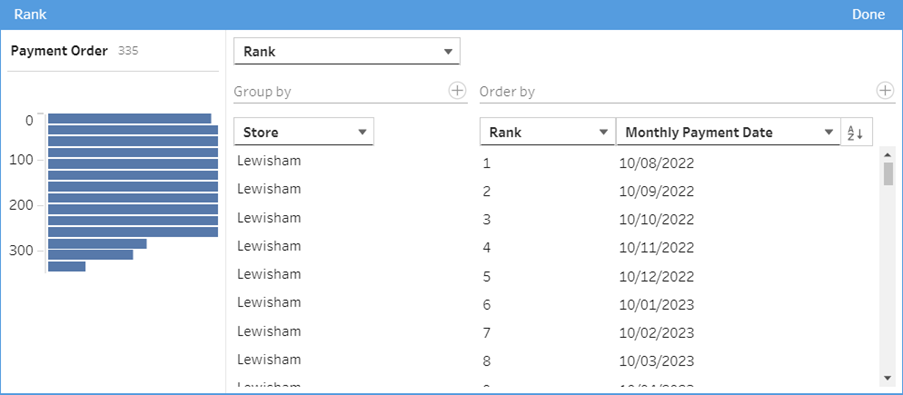
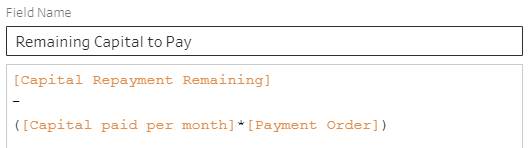
This new field can then be used to calculate the “Remaining Capital to Pay” at each of the monthly payment dates. In a calculated field, this would be found by the “Capital Paid per Month” multiplied by the “Payment Order” made by the Rank, and then subtracting this from the “Capital Payment Remaining” as shown below.
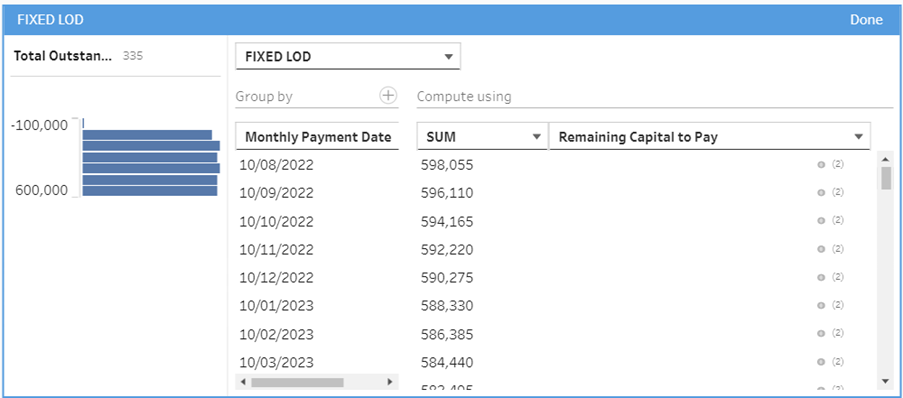
Step 6: Calculating total outstanding capital
A fixed LOD calculation is the final step to answer the second question from C&BSCo involving finding the “Total Outstanding Capital” across the two stores. Within this the “Monthly Payment Date” is used to group the sum of the “Remaining Capital to Pay”.
Summary
By using scaffolding, ranks, and LODs in Tableau Prep, we were able to transform raw mortgage data into a better structured and more insightful dataset that answered key questions provided by the stakeholder.
This challenge reinforced the importance of these data preparation techniques to handle missing values and improve reporting accuracy. It was a great exercise in applying theory to a practical scenario, strengthening our ability to work with real-world datasets.